


others
Bulls gain some ground, bears are still around the corner – Crypto News
- The daily chart of the NZD/JPY shows a period of consolidation following last week’s sharp losses.
- Red bars seen consistently on the daily MACD further depict a steady selling momentum.
- RSI values on the hourly chart signal short-term buyer domination.
In Wednesday’s session, the NZD/JPY showed some gains. Bears seem to be consolidating last week’s losses but for the short term, the outlook is turning negative. The overall trend, however, remains bullish.
On the daily chart, the Relative Strength Index (RSI) displays a positive slope in negative territory. It quickly corrected overbought conditions reached last week and fell below 50. This indicates a shift in momentum with sellers gaining ground. The consistently flat red bars on the Moving Average Convergence Divergence (MACD) histogram further show a decline in positive momentum, reinforcing the selling pressure taking place.
NZD/JPY daily chart
Examining the hourly chart, RSI values hover within positive territory suggesting buyers dominate shorter-term trades. Simultaneously, the decreasing green bars on the MACD histogram indicate a drop in positive momentum. Despite temporary bearish pressure, the pair displays strength in a broader perspective, given its position above the 100 and 200-day Simple Moving Averages (SMAs).
NZD/JPY hourly chart
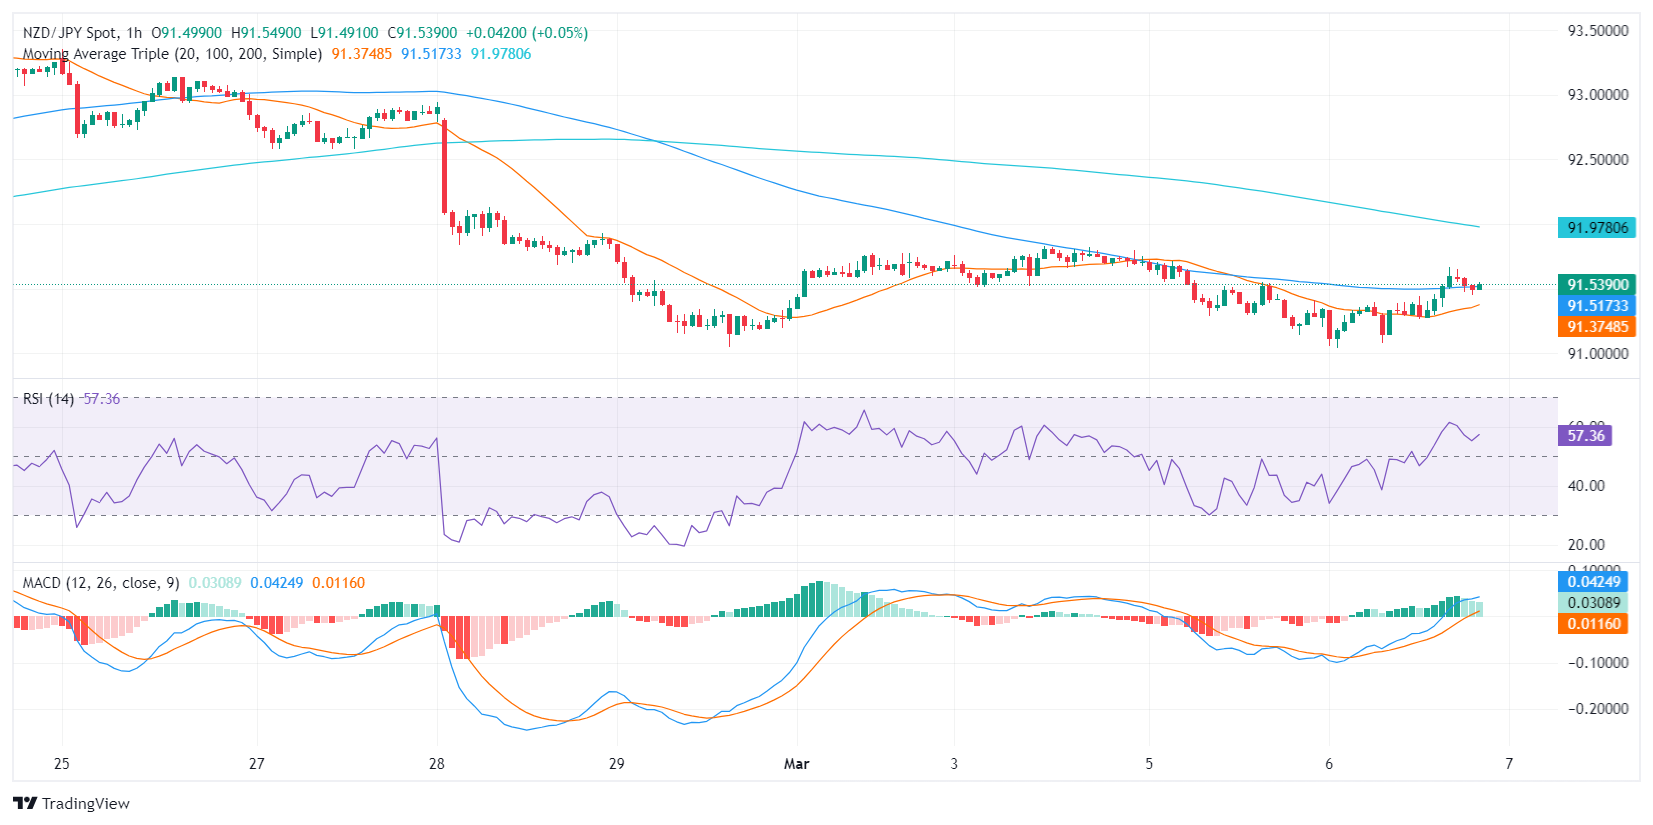
In conclusion, while sellers appear to have gained traction intraday according to the daily RSI and MACD, the overarching trend remains bullish. The pair holds resilience above the long-term averages.


-
others1 week ago
Will Ethereum Price Rally to $3,200 as Wall Street Pivots from BTC to ETH – Crypto News
-
![DIS Elliott Wave technical analysis [Video]](https://dripp.zone/news/wp-content/uploads/2025/06/DIS-Elliott-Wave-technical-analysis-Video-Crypto-News-400x240.jpg)
![DIS Elliott Wave technical analysis [Video]](https://dripp.zone/news/wp-content/uploads/2025/06/DIS-Elliott-Wave-technical-analysis-Video-Crypto-News-80x80.jpg) others1 week ago
others1 week agoSkies are clearing for Delta as stock soars 13% on earnings beat – Crypto News
-
others1 week ago
Skies are clearing for Delta as stock soars 13% on earnings beat – Crypto News
-

 Blockchain1 week ago
Insomnia Labs Debuts Stablecoin Credit Platform for Creators – Crypto News
-

 Blockchain1 week ago
Ant Group Eyes USDC Integration Circle’s: Report – Crypto News
-

 Cryptocurrency1 week ago
Tornado Cash Judge Won’t Let One Case Be Mentioned in Roman Storm’s Trial: Here’s Why – Crypto News
-

 Blockchain1 week ago
XRP Rally Possible If Senate Web3 Crypto Summit Goes Well – Crypto News
-

 others1 week ago
USD/CAD trades with positive bias below 1.3700; looks to FOMC minutes for fresh impetus – Crypto News
-

 Blockchain1 week ago
Kraken and Backed Expand Tokenized Equities to BNB Chain – Crypto News
-

 others1 week ago
EUR/GBP posts modest gain above 0.8600 ahead of German inflation data – Crypto News
-
 Cryptocurrency1 week ago
Bitcoin Breaks New Record at $111K, What’s Fueling the $120K Price Target? – Crypto News
-
Technology1 week ago
XRP Eyes $3 Breakout Amid Rising BlackRock ETF Speculation – Crypto News
-
Business7 days ago
PENGU Rallies Over 20% Amid Coinbase’s Pudgy Penguins PFP Frenzy – Crypto News
-

 Blockchain4 days ago
Robinhood Dealing With Fallout of Tokenized Equities Offering – Crypto News
-

 Cryptocurrency4 days ago
Whale Sells $407K TRUMP, Loses $1.37M in Exit – Crypto News
-
Technology1 week ago
Solana Meme Coin PNUT Rallies 10% Amid Elon Musk’s Statement – Crypto News
-
 Cryptocurrency1 week ago
Is ETH Finally Ready to Shoot For $3K? (Ethereum Price Analysis) – Crypto News
-

 Blockchain1 week ago
Binance Founder Backs BNB Treasury Company Aiming For US IPO – Crypto News
-

 Blockchain1 week ago
Ethereum Bulls Roar — $3K Beckons After 5% Spike – Crypto News
-
Business1 week ago
Did Ripple Really Win XRP Lawsuit Despite $125M Fine? Lawyer Fires Back at CEO – Crypto News
-

 Cryptocurrency1 week ago
XRP price forecast as coins surges 2.19% to $2.33 – Crypto News
-

 Technology1 week ago
Perplexity launches Comet, an AI-powered browser to challenge Google Chrome; OpenAI expected to enter the space soon – Crypto News
-

 Blockchain1 week ago
SUI Chart Pattern Confirmation Sets $3.89 Price Target – Crypto News
-
Technology1 week ago
Breaking: SharpLink Purchases 10,000 ETH from Ethereum Foundation, SBET Stock Up 7% – Crypto News
-

 others7 days ago
EUR/GBP climbs as weak UK data fuels BoE rate cut speculation – Crypto News
-

 Blockchain7 days ago
Bitcoin Hits All-Time High as Crypto Legislation Votes Near – Crypto News
-

 Cryptocurrency1 week ago
Bulls In Control But Resistance Persists at $2.30. What Next? – Crypto News
-
Technology1 week ago
GameSquare Stock Shoots 58% After Revealing $100 Million Ethereum Treasury Strategy – Crypto News
-

 others1 week ago
Australian Dollar remains stronger due to persistent inflation risks, FOMC Minutes eyed – Crypto News
-

 others1 week ago
US Dollar Resurgence May Be Around the Corner, According to Barclays Currency Strategist – Here’s Why: Report – Crypto News
-
others1 week ago
Trump Jr. Backed Thumzup Media To Invest In ETH, XRP, SOL, DOGE And LTC – Crypto News
-
 Cryptocurrency1 week ago
Bitcoin Hits Record Peak. How High Can It Surge in 2025? – Crypto News
-
Technology1 week ago
VC Firm Ego Death Capital Closes $100M Funding to Back Bitcoin-Based Projects – Crypto News
-
Cryptocurrency1 week ago
Tokenized Securities Are Still Securities, US SEC Warns Robinhood, Kraken – Crypto News
-

 others1 week ago
NovaEx Launches with a Security-First Crypto Trading Platform Offering Deep Liquidity and Institutional-Grade Infrastructure – Crypto News
-
 Blockchain1 week ago
Australia Banks Join Digital Currency Trial for Tokenized Assets – Crypto News
-

 Metaverse1 week ago
How Brands Can Deepen Customer Connections in the Metaverse – Crypto News
-

 others1 week ago
Anthony Scaramucci Says $180,000 Bitcoin Price Explosion Possible As BTC ‘Supremacy’ Creeps Up – Here’s His Timeline – Crypto News
-
Cryptocurrency1 week ago
Bitcoin Breaks New Record at $111K, What’s Fueling the $120K Price Target? – Crypto News
-
Business1 week ago
US Senate To Release CLARITY Act Draft Next Week – Crypto News
-

 others1 week ago
$687,220,000 in Bitcoin Shorts Liquidated in Just One Hour As BTC Explodes To $116,000 – Crypto News
-

 Business7 days ago
S&P Global Downgrades Saks Global’s Credit Rating – Crypto News
-

 Cryptocurrency4 days ago
Satoshi-Era Bitcoin Whale Moves Another $2.42 Billion, What’s Happening? – Crypto News
-

 Technology1 week ago
Google’s worst nightmare? OpenAI’s new AI web browser is coming soon to challenge Chrome – Crypto News
-

 Technology1 week ago
10 Smartchoice tablets from top brands, curated for everyday use, up to 45% off before Amazon Prime Day Sale – Crypto News
-
others1 week ago
China’s Ant Group With 1.4B Users Taps Circle to Integrate USDC – Crypto News
-
Business1 week ago
Just In: DeFi Development Corp. Adds 47,272 SOL, Now Holds $103M In Solana – Crypto News
-

 Cryptocurrency1 week ago
Bitcoin crash narrative returns as geopolitical tensions mount – Crypto News
-

 Cryptocurrency1 week ago
Ethereum ascends: Institutional pivot and dormant whale moves signal a new era – Crypto News
-
Business1 week ago
XRP Open Interest Skyrockets Ahead Of ProShares XRP ETF Approval – Crypto News