


others
AMZN starting to react from the blue box area – Crypto News
In this technical blog, we will look at the past performance of the 1-hour Elliot Wave Charts of Amazon ticker symbol: AMZN. In which, the rally from 01 May 2023 low unfolded as an impulse structure. And showed a higher high sequence favored more upside extension to take place. Therefore, we advised members not to sell the stock & buy the dips in 3, 7, or 11 swings at the blue box areas. We will explain the structure & forecast below:
AMZN 1-Hour Elliott Wave Chart From 5.23.2023
Here’s the 1hr Elliott wave chart from the 5/23/2023 Post-Market update. In which, the rally from the 5/01/2023 low unfolded in an impulse sequence where wave 1 ended at $113.28 high. Then wave 2 pullback ended at $109.24 & made a rally higher in wave 3 towards $118.75 high. Down from there, the stock made a pullback in wave 4 while the internals of that pullback unfolded as Elliott wave zigzag structure where wave ((a)) ended at $115.70 low. Wave ((b)) ended at $117.24 high and wave ((c)) managed to reach the blue box area at $113.82-$111.70 area. From there, buyers were expected to appear looking for the next leg higher or for a 3 wave bounce minimum.
AMZN Latest 1-Hour Elliott Wave Chart
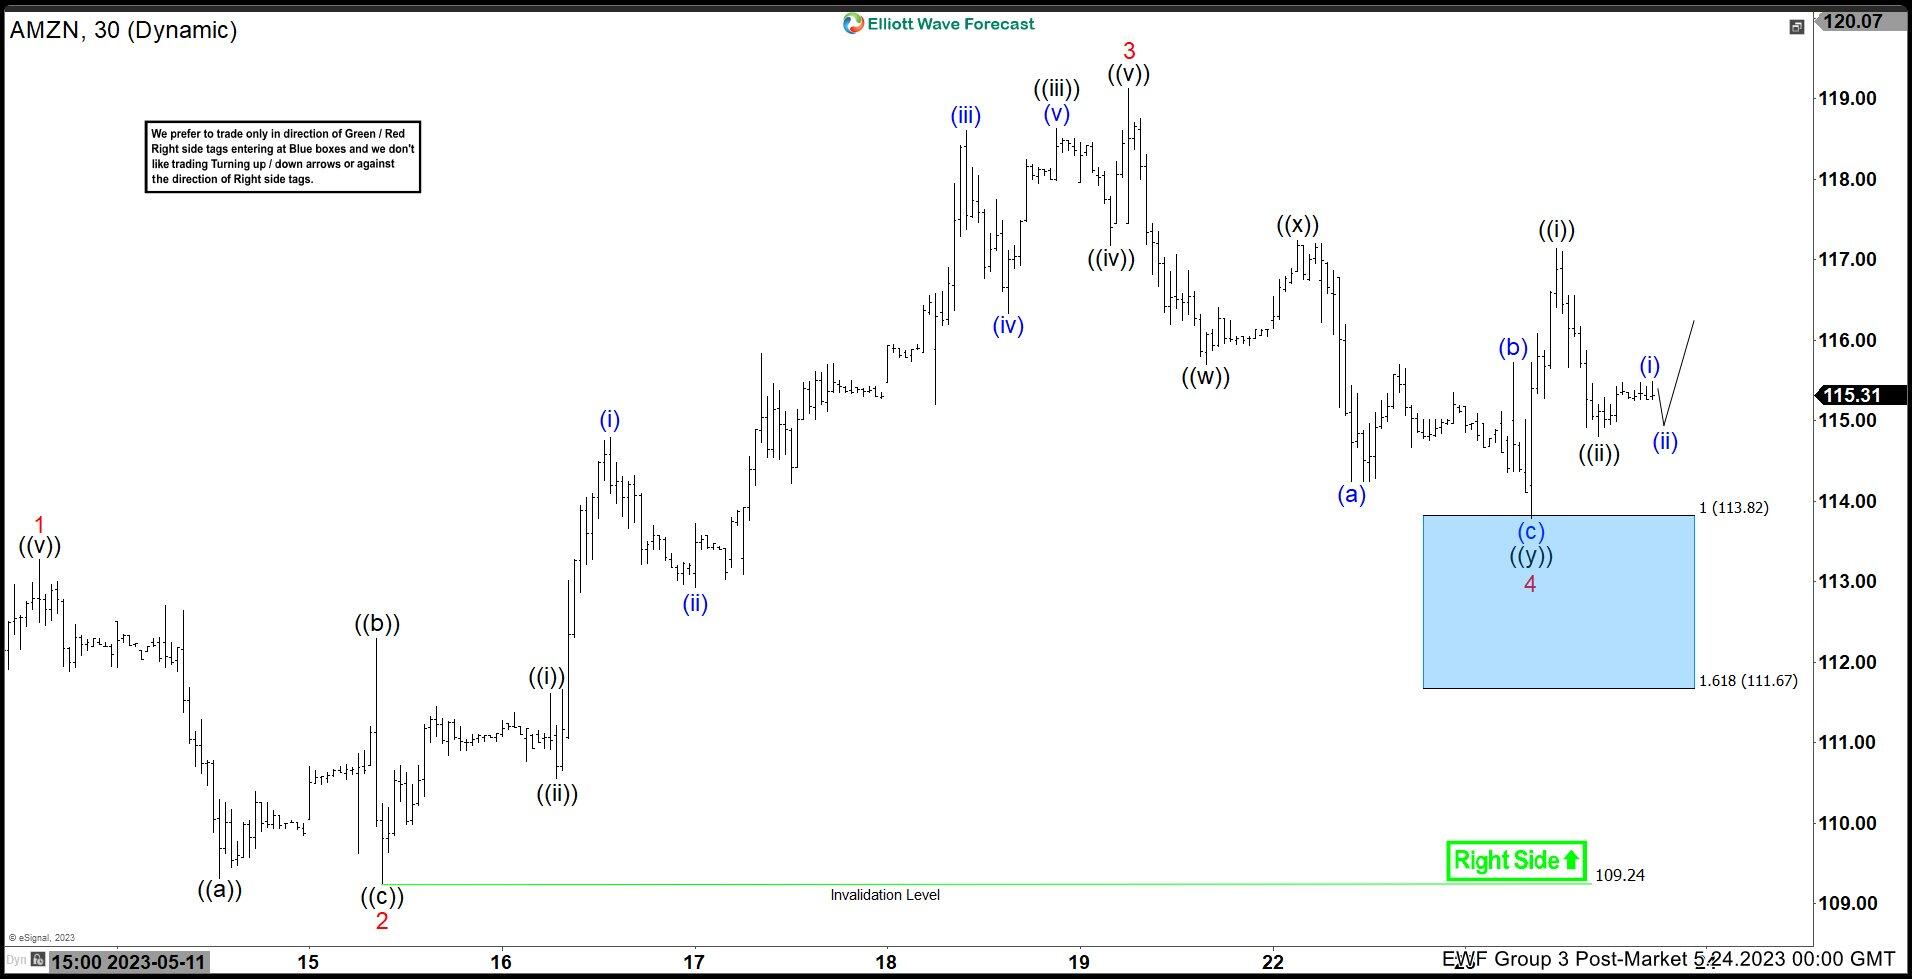
This is the latest 1hr Elliott wave charts from the 5/24/2023 Post-Market update. In which the stock is showing a reaction higher taking place, right after ending the pullback within the blue box area. Allowed members to create a risk-free position shortly after taking the long position at the blue box area. However, a break above the $118.75 high is still needed to confirm the next extension higher & avoid a double correction lower. It’s important to note that with further data, the pullback adjusted to a double three correction.


-

 Blockchain1 day ago
On-Chain Tokenization for Payments Professionals – Crypto News
-
Cryptocurrency6 days ago
Pi Community Highlights Pi Coin’s Slow Growth As ‘Strategic’ – Crypto News
-

 Blockchain1 week ago
CZ claps back against ‘baseless’ US plea deal allegations – Crypto News
-

 Technology1 week ago
Apple ramps up India production amid China uncertainty, assembles $22 billion worth iPhones in a year – Crypto News
-
Business5 days ago
Cardano (ADA) and Dogecoin (DOGE) Eye For Bullish Recovery – Crypto News
-

 Business5 days ago
Worldpay and FIS Deals Echo 2019’s Payments Megamergers – Crypto News
-
![Shiba Inu [SHIB] price prediction - A 70% rally next after 900%+ burn rate hike?](https://dripp.zone/news/wp-content/uploads/2025/04/Shiba-Inu-SHIB-price-prediction-A-70-rally-next-400x240.png)
![Shiba Inu [SHIB] price prediction - A 70% rally next after 900%+ burn rate hike?](https://dripp.zone/news/wp-content/uploads/2025/04/Shiba-Inu-SHIB-price-prediction-A-70-rally-next-80x80.png) Cryptocurrency1 week ago
Cryptocurrency1 week agoShiba Inu [SHIB] price prediction – A 70% rally next after 900%+ burn rate hike? – Crypto News
-

 others1 week ago
Gold consolidates near all-time peak as bulls pause for breather – Crypto News
-

 Cryptocurrency7 days ago
White House Mulls Bitcoin Reserve Backed by Gold and Tariffs – Crypto News
-

 Cryptocurrency6 days ago
OKX Returns to US Market Following $505M DOJ Deal – Crypto News
-

 Blockchain5 days ago
Solana Turns Bullish On 8H Chart – Break Above $147 Could Confirm New Trend – Crypto News
-
Technology5 days ago
Expert Predicts Pi Network Price Volatility After Shady Activity On Banxa – Crypto News
-

 Blockchain1 week ago
XRP Price To Hit $45? Here’s What Happens If It Mimics 2017 And 2021 Rallies – Crypto News
-

 others1 week ago
Ripple Community Remains Disappointed With Hinman Report, What’s Next? – Crypto News
-

 Metaverse1 week ago
Forget DeepSeek. Large language models are getting cheaper still – Crypto News
-

 others1 week ago
Crypto Strategist Sees Solana-Based Memecoin Surging Higher, Says One AI Altcoin Flashing Strong Chart – Crypto News
-

 Cryptocurrency1 week ago
Pepe is on the verge breakout to $0.0000078 as gold cross nears. – Crypto News
-

 Blockchain6 days ago
Bitcoin online chatter flips bullish as price chops at $85K: Santiment – Crypto News
-
 Cryptocurrency5 days ago
Judge Pauses 18-State Lawsuit Against SEC, Saying It Could ‘Potentially Be Resolved’ – Crypto News
-
Business5 days ago
Coinbase Reveals Efforts To Make Its Solana Infrastructure Faster, Here’s All – Crypto News
-

 Cryptocurrency1 week ago
Bitcoin – Here’s what’s next after sellers near exhaustion levels – Crypto News
-

 others1 week ago
On-Chain Indicator Suggests Ethereum (ETH) Could Be Undervalued, According to Crypto Analyst – Crypto News
-

 others1 week ago
Mexican Peso ends week strong as USD plunges on China tariff retaliation – Crypto News
-

 Blockchain1 week ago
On-Chain Clues Suggest Bitcoin Bounce Might Be a False Signal—Here’s What to Know – Crypto News
-

 others1 week ago
China’s Copper imports drop – ING – Crypto News
-

 Cryptocurrency6 days ago
A decade in, Liberland needs the Bitcoin standard more than ever – Crypto News
-

 Technology6 days ago
India, Australia explore bilateral data-sharing treaty to tackle cybercrime – Crypto News
-

 Technology5 days ago
Moto Book 60 laptop, Pad 60 Pro launched in India: Price, features, battery and more – Crypto News
-

 others5 days ago
UnitedHealth stock caves 23% as it cuts full-year guidance – Crypto News
-
Technology5 days ago
Coinbase Reveals Efforts To Make Its Solana Infrastructure Faster, Here’s All – Crypto News
-
others5 days ago
Coinbase Reveals Efforts To Make Its Solana Infrastructure Faster, Here’s All – Crypto News
-
others5 days ago
How High Should Dogecoin Price Rise to Turn $10K to $100K? – Crypto News
-

 Technology1 week ago
Price drop on 43 inch TVs: Grab the best deals on Samsung, Sony, Xiaomi and more, up to 57% off – Crypto News
-
 Technology1 week ago
3 Altcoins to Buy as US Senate Banking Chair Gives August Deadline For Major Crypto Bills – Crypto News
-

 Blockchain1 week ago
Boosting Ethereum: Bankless Cofounder Lays Out New Vision For Price Surge – Crypto News
-
![Bearish sequence in Nifty favors downside [Video]](https://dripp.zone/news/wp-content/uploads/2025/02/Bearish-sequence-in-Nifty-favors-downside-Video-Crypto-News-400x240.png)
![Bearish sequence in Nifty favors downside [Video]](https://dripp.zone/news/wp-content/uploads/2025/02/Bearish-sequence-in-Nifty-favors-downside-Video-Crypto-News-80x80.png) others1 week ago
others1 week agoDow Jones recovers ground to post one of its best weeks in years – Crypto News
-

 Cryptocurrency1 week ago
Scottish School Will Accept Bitcoin Payments, May Launch BTC Reserve – Crypto News
-

 Blockchain1 week ago
‘Bitcoin Standard’ author to develop Austrian economics curriculum for UK school – Crypto News
-

 Business1 week ago
Michael Saylor Hints At Another MicroStrategy Bitcoin Purchase, BTC Price To Rally? – Crypto News
-
 others1 week ago
Mantra Team Responds As The OM Token Price Crashes Over 80% In 24 Hours – Crypto News
-

 others1 week ago
USD/CAD falls toward 1.3850 due to potential US recession, persistent inflation – Crypto News
-

 Blockchain1 week ago
Crypto markets ‘relatively orderly’ despite Trump tariff chaos: NYDIG – Crypto News
-

 others6 days ago
President Trump Planning Launch of New Monopoly-Inspired Crypto Game: Report – Crypto News
-

 Blockchain6 days ago
Stablecoins’ dominance due to limitations of US banking — Jerald David – Crypto News
-

 Cryptocurrency6 days ago
SOL remains bullish amid broader market stagnation – Crypto News
-

 Technology6 days ago
Spotify down: Music streaming giant leaves thousands of users affected globally – Crypto News
-
Business5 days ago
Crypto Whales Bag $20M In AAVE & UNI, Are DeFi Tokens Eyeing Price Rally? – Crypto News
-

 Blockchain5 days ago
Jio partnership to drive real-world Web3 adoption for 450M users – Crypto News
-

 Metaverse5 days ago
Le Chat, the cat-bot France has pinned its AI hopes on – Crypto News
-

 Cryptocurrency5 days ago
Performance of Hard Assets Bitcoin and Gold ‘Remains Remarkable:’ Glassnode – Crypto News