


others
Apecoin Price Shows a Potential 6% Rise, But There’s a Catch – Crypto News

Published 10 minutes ago
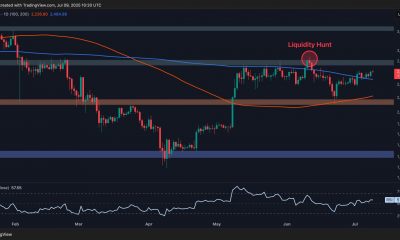
A pair of new higher high and higher low formations in Apecoin’s daily time frame chart create a sense of steady recovery in this coin. Furthermore, the rising prices resonating between two parallel trend lines hint at a parallel channel pattern forming. Here’s how this chart pattern may influence the future price of Apecoin price.
Key Points:
- A parallel channel pattern is currently carrying the ongoing recovery in Apecoin price.
- The $5.26 is a highly concentrated resistance zone for the coin holder.
- The intraday trading volume in Apecoin is $173. Million, indicating a 26% gain
 Source- Tradingview
Amid the recent recovery in the crypto market, the APE price has recently formed a local top at $5.26 resistance. However, this level, accompanied by other technical resistances such as the 200-day EMA and the parallel channel pattern trendline, creates a high supply zone.
Also read- Explained: What is Physical NFT? and How to Sell Physical Items as NFT
In theory, the rising parallel channel pattern is a famous bearish continuation pattern. Although this pattern carries a steady, the chances are higher that loss of bullish momentum will break the lower trendline. Thus, a bearish breakdown from the support trendline will intensify the selling pressure and resume the prevailing downtrend.
Having said that, the coin buyers could enjoy the ongoing police trend until the channel pattern is intact. By press time, the Apecoin price trades at $5 and is 11.% up in the last two days.
With sustained buying, the coin price will rise another 5% to revisit the dollar 5.2 resistance mentioned above. Traders should be cautious at this level as it holds the power to undermine the bullish momentum.
technical indicators
Vortex indicator: the reduced gap between the VI+(Blue) and VI-(Red) slope indicates a loss of bullishness momentum. However, a bearish crossover between these slopes is prevented, indicating the buyer still has the upper hand.
EMA’s: the 20-50-and-100-day EMA wavering around the $4.4 to $4.2 mark creates a strong support zone.
Apecoin Intraday Price Levels
- Spot price: $4.93
- Trend: Bullish
- Volatility: low
- Resistance level- $5.2 and $6
- Support level- $4.4 and $4.2
The content presented may include the personal opinion of the author and is subject to market condition. Do your market research before investing in cryptocurrencies. The author or the publication does not hold any responsibility for your personal financial loss.


![Spotify (SPOT) Elliott Wave analysis [Video]](https://dripp.zone/news/wp-content/uploads/2025/07/Spotify-SPOT-Elliott-Wave-analysis-Video-Crypto-News-400x240.jpg)
![Spotify (SPOT) Elliott Wave analysis [Video]](https://dripp.zone/news/wp-content/uploads/2025/07/Spotify-SPOT-Elliott-Wave-analysis-Video-Crypto-News-80x80.jpg)


-
![DIS Elliott Wave technical analysis [Video]](https://dripp.zone/news/wp-content/uploads/2025/06/DIS-Elliott-Wave-technical-analysis-Video-Crypto-News-400x240.jpg)
![DIS Elliott Wave technical analysis [Video]](https://dripp.zone/news/wp-content/uploads/2025/06/DIS-Elliott-Wave-technical-analysis-Video-Crypto-News-80x80.jpg) others1 week ago
others1 week agoSkies are clearing for Delta as stock soars 13% on earnings beat – Crypto News
-
others1 week ago
Skies are clearing for Delta as stock soars 13% on earnings beat – Crypto News
-

 Blockchain1 week ago
Insomnia Labs Debuts Stablecoin Credit Platform for Creators – Crypto News
-

 Cryptocurrency1 week ago
Tornado Cash Judge Won’t Let One Case Be Mentioned in Roman Storm’s Trial: Here’s Why – Crypto News
-

 Blockchain1 week ago
Kraken and Backed Expand Tokenized Equities to BNB Chain – Crypto News
-

 Blockchain1 week ago
Ant Group Eyes USDC Integration Circle’s: Report – Crypto News
-
 Cryptocurrency1 week ago
Bitcoin Breaks New Record at $111K, What’s Fueling the $120K Price Target? – Crypto News
-
Business1 week ago
PENGU Rallies Over 20% Amid Coinbase’s Pudgy Penguins PFP Frenzy – Crypto News
-

 Cryptocurrency5 days ago
Whale Sells $407K TRUMP, Loses $1.37M in Exit – Crypto News
-
 Cryptocurrency1 week ago
Is ETH Finally Ready to Shoot For $3K? (Ethereum Price Analysis) – Crypto News
-

 Blockchain1 week ago
XRP Rally Possible If Senate Web3 Crypto Summit Goes Well – Crypto News
-

 others1 week ago
USD/CAD trades with positive bias below 1.3700; looks to FOMC minutes for fresh impetus – Crypto News
-

 Blockchain1 week ago
Binance Founder Backs BNB Treasury Company Aiming For US IPO – Crypto News
-

 Blockchain1 week ago
Australia Banks Join Digital Currency Trial for Tokenized Assets – Crypto News
-
Business1 week ago
Did Ripple Really Win XRP Lawsuit Despite $125M Fine? Lawyer Fires Back at CEO – Crypto News
-

 others1 week ago
EUR/GBP posts modest gain above 0.8600 ahead of German inflation data – Crypto News
-

 Cryptocurrency1 week ago
XRP price forecast as coins surges 2.19% to $2.33 – Crypto News
-

 Metaverse1 week ago
How Brands Can Deepen Customer Connections in the Metaverse – Crypto News
-

 Blockchain1 week ago
SUI Chart Pattern Confirmation Sets $3.89 Price Target – Crypto News
-
Technology1 week ago
XRP Eyes $3 Breakout Amid Rising BlackRock ETF Speculation – Crypto News
-

 Blockchain5 days ago
Robinhood Dealing With Fallout of Tokenized Equities Offering – Crypto News
-

 others1 week ago
US Dollar Resurgence May Be Around the Corner, According to Barclays Currency Strategist – Here’s Why: Report – Crypto News
-

 Technology1 week ago
Google’s worst nightmare? OpenAI’s new AI web browser is coming soon to challenge Chrome – Crypto News
-
 Cryptocurrency1 week ago
Bitcoin Hits Record Peak. How High Can It Surge in 2025? – Crypto News
-

 Blockchain1 week ago
Ethereum Bulls Roar — $3K Beckons After 5% Spike – Crypto News
-
Technology1 week ago
VC Firm Ego Death Capital Closes $100M Funding to Back Bitcoin-Based Projects – Crypto News
-
Cryptocurrency1 week ago
Tokenized Securities Are Still Securities, US SEC Warns Robinhood, Kraken – Crypto News
-

 others1 week ago
NovaEx Launches with a Security-First Crypto Trading Platform Offering Deep Liquidity and Institutional-Grade Infrastructure – Crypto News
-

 Technology1 week ago
Perplexity launches Comet, an AI-powered browser to challenge Google Chrome; OpenAI expected to enter the space soon – Crypto News
-
Cryptocurrency1 week ago
Bitcoin Breaks New Record at $111K, What’s Fueling the $120K Price Target? – Crypto News
-
Technology1 week ago
Breaking: SharpLink Purchases 10,000 ETH from Ethereum Foundation, SBET Stock Up 7% – Crypto News
-

 others1 week ago
EUR/GBP climbs as weak UK data fuels BoE rate cut speculation – Crypto News
-

 Business1 week ago
S&P Global Downgrades Saks Global’s Credit Rating – Crypto News
-

 Blockchain1 week ago
Bitcoin Hits All-Time High as Crypto Legislation Votes Near – Crypto News
-

 Cryptocurrency5 days ago
Satoshi-Era Bitcoin Whale Moves Another $2.42 Billion, What’s Happening? – Crypto News
-

 others1 week ago
Australian Dollar remains stronger due to persistent inflation risks, FOMC Minutes eyed – Crypto News
-
others1 week ago
Trump Jr. Backed Thumzup Media To Invest In ETH, XRP, SOL, DOGE And LTC – Crypto News
-

 Technology1 week ago
10 Smartchoice tablets from top brands, curated for everyday use, up to 45% off before Amazon Prime Day Sale – Crypto News
-
others1 week ago
China’s Ant Group With 1.4B Users Taps Circle to Integrate USDC – Crypto News
-

 others1 week ago
Anthony Scaramucci Says $180,000 Bitcoin Price Explosion Possible As BTC ‘Supremacy’ Creeps Up – Here’s His Timeline – Crypto News
-
Business1 week ago
US Senate To Release CLARITY Act Draft Next Week – Crypto News
-

 others1 week ago
$687,220,000 in Bitcoin Shorts Liquidated in Just One Hour As BTC Explodes To $116,000 – Crypto News
-

 De-fi1 week ago
Ousted Movement Labs Co-Founder Sues Startup in Delaware Court – Crypto News
-
Business1 week ago
XRP Set for Big Week as ProShares ETF Launches July 18 – Crypto News
-
Technology1 week ago
Hyperliquid Hits Record $10.6B OI As HYPE Price Records New ATH – Crypto News
-

 Blockchain6 days ago
Ziglu Faces $2.7M Shortfall as Crypto Fintech Enters Special Administration – Crypto News
-

 Cryptocurrency5 days ago
Bitcoin Breaches $120K, Institutional FOMO Takes and House Debate Propel Gains – Crypto News
-

 Blockchain1 week ago
Analyst Predicts 50% “Moonshot” For XRP Price If This Line Breaks – Crypto News
-
others1 week ago
Donald Trump Pushes For A 300 Basis Points Fed Rate Cut – Crypto News
-
Technology1 week ago
Breaking: Bitcoin Price Hits New ATH Amid Trump Tariff Scare – Crypto News