


others
Breakdown of H&S looks likely – Crypto News
- A mild recovery in S&P500 futures is indicating that the risk-on mood is attempting to regain traction.
- A breakdown of an H&S chart pattern will result in the sheer downside ahead.
- The RSI (14) has slipped into the bearish range of 20.00-40.00, which indicates more weakness ahead.
The GBP/USD pair has sensed a temporary demand below the critical support of 1.1900 in the Asian session, however, the broader set of the risk profile is extremely negative. The Cable asset is likely to remain on the tenterhooks as stronger United States Job market data has accelerated the odds of further policy tightening consideration by the Federal Reserve (Fed).
S&P500 futures have displayed a higher tick in early Asia after a massive sell-off on Thursday but still portraying caution before turning to risk-sensitive assets. The US Dollar Index (DXY) is expected to display a sideways action ahead of the release of the US Nonfarm Payrolls (NFP) data.
On a four-hour scale, the Cable is hovering near the neckline of the Head and Shoulder (H&S). charts pattern, which is plotted from December 29 low around 1.1900. The aforementioned chart pattern indicates a stretched inventory distribution, which results in volatility expansion after a breakdown.
Declining 20- and 50-period Exponential Moving Averages (EMAs) at 1.1990 and 1.2010 respectively add to the downside filters.
Also, the Relative Strength Index (RSI) (14) has slipped into the bearish range of 20.00-40.00, which indicates more weakness ahead.
Going forward, a slippage below Thursday’s low at 1.1873 will drag the major towards the November 21 low around 1.1778. A slippage below the latter will expose Cable for more downside towards the round-level support at 1.1700.
On the flip side, the Pound Sterling needs to push the cables Decisively above December 27 high around 1.2100 for an upside move, which will drive the major towards December 21 high at 1.2147 followed by December 21 high around 1.2200.
GBP/USD four-hour chart


-

 Blockchain5 days ago
Institutional Demand Surges As Ethereum Sets New Inflow Records – Crypto News
-

 Blockchain5 days ago
DeFi Development Nears 1 Million Solana In Treasury – Crypto News
-
Business1 week ago
XLM Is More Bullish Than ETH, SOL, And XRP, Peter Brandt Declares – Crypto News
-

 Cryptocurrency1 week ago
Anarchy, crime and stablecoins – Blockworks – Crypto News
-
Business1 week ago
XRP Lawsuit Update: Ripple Paid $125M in Cash, Settlement Hinges on Appeal – Crypto News
-

 Cryptocurrency1 week ago
Bitcoin trades near $119K after new all-time high; Coinbase rebrands wallet to ‘Base App’ – Crypto News
-
Technology1 week ago
“Decentralized Ponzi Scheme”- Gold Bug Peter Schiff Slams Landmark Crypto Bills – Crypto News
-

 Cryptocurrency1 week ago
California Sheriffs Believe 74-Year-Old’s Disappearance Linked to Son’s Crypto Fortune – Crypto News
-
 Cryptocurrency7 days ago
Altseason heats up, but Bitcoin could face short-term pullback – How? – Crypto News
-

 others1 week ago
VanEck Details Key Drivers Boosting Bitcoin Price, Including Corporate Treasury Demand, ETF Flows and More – Crypto News
-

 Metaverse1 week ago
Zoho Zia LLM launched with speech-to-text models and AI agent marketplace: All you need to know – Crypto News
-

 De-fi1 week ago
BNB Chain Teases New Blockchain with Privacy Features to Compete With Crypto Exchanges – Crypto News
-
Technology1 week ago
Breaking: GENIUS Act Becomes First Major Crypto Legislation as Trump Signs Bill – Crypto News
-

 De-fi1 week ago
Crypto Market Cap Hits $4 Trillion Milestone as US House Passes Landmark Bills – Crypto News
-

 Cryptocurrency7 days ago
Shytoshi Kusama Breaks Silence on New SHIB AI Whitepaper and Transformed Future – Crypto News
-

 Cryptocurrency6 days ago
Sanctum acquires Ironforge, plots transaction infrastructure vertical – Crypto News
-

 Cryptocurrency6 days ago
XRP Price Hits All-Time High at $3.66 — Can It Smash Through $4 After Trump Win & SEC Shake-Up? – Crypto News
-
Business6 days ago
Vitalik Buterin Approves Gas Limit Hike, Warns Against Risky Ethereum Scaling – Crypto News
-

 Blockchain5 days ago
Strategy to keep STRC Fund Pegged to $100 – Crypto News
-
Business1 week ago
CLARITY Bill Could Delay Over Last-Minute Push for Anti-CBDC Clause; Report – Crypto News
-

 Blockchain1 week ago
TON’s Next Stop Could Be $3.50, Here’s Why – Crypto News
-

 others1 week ago
GBP/USD rallies on US PPI dip and Trump’s potential Powell removal – Crypto News
-
others1 week ago
GBP/USD rallies on US PPI dip and Trump’s potential Powell removal – Crypto News
-
Cryptocurrency1 week ago
Russia’s $85 Billion Sberbank to Launch Crypto Custody Services – Crypto News
-
 Technology1 week ago
Europe’s answer to ChatGPT? Mistral adds voice and research features to Le Chat AI – Crypto News
-

 De-fi1 week ago
U.S. House Passes Clarity, GENIUS, and Anti-CBDC Acts With Historic Bipartisan Support for Crypto – Crypto News
-
 Technology1 week ago
Malicious code found in fake coding extensions used to steal crypto – Crypto News
-
Cryptocurrency1 week ago
XRP Price Spikes to Record Highs As Momentum Signals Extended Gains – Crypto News
-

 Technology1 week ago
Meta’s AI Studio: Red flag or red herring? – Crypto News
-

 Blockchain1 week ago
Why Bitcoin self-custody is declining in the ETF era – Crypto News
-
Cryptocurrency1 week ago
US House passes three key crypto bills; market reaction muted as Bitcoin dips – Crypto News
-
De-fi1 week ago
Crypto Market Cap Hits $4 Trillion Milestone as US House Passes Landmark Bills – Crypto News
-

 Cryptocurrency7 days ago
Arthur Hayes-linked wallet bags $2M worth of AAVE and LDO in an OTC deal – Crypto News
-
others6 days ago
Why Is The Crypto Market Rising Today? – Crypto News
-

 Blockchain5 days ago
How to Use Google Gemini to Turn Crypto News Into Trade Signals – Crypto News
-
others5 days ago
Breaking: Polymarket Reenters US Market With Exchange Acquisition As Probe Ends – Crypto News
-

 Cryptocurrency5 days ago
Solana Clinches 5-Month High, Where to From Here? – Crypto News
-

 Technology5 days ago
Grab up to 43% off on best selling premium laptops from Apple, Asus and more – Crypto News
-

 Blockchain5 days ago
XRP Could Skyrocket 500% Against Bitcoin, Analyst Warns – Crypto News
-
 De-fi1 week ago
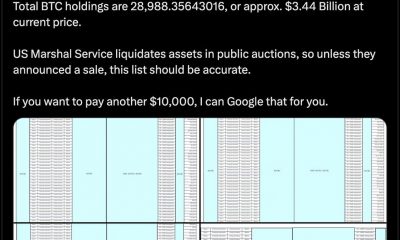
U.S. Marshals Peg Federal Bitcoin Holdings at 28,988 Tokens Worth $3.4 B – Crypto News
-

 Blockchain1 week ago
Nasdaq Exchange Files SEC Form to List Staking Ethereum ETF – Crypto News
-

 Cryptocurrency1 week ago
Ethereum price surges 6% to $2,800 as shorts suffer amid $500M crypto liquidation – Crypto News
-

 Cryptocurrency1 week ago
Friday charts: Fiscal dominance and super intelligence – Crypto News
-

 De-fi1 week ago
Trump’s Crypto Assets Now Comprise a Key Part of Family Fortune Worth Billions – Crypto News
-
Business7 days ago
Pi Coin Price Technical Analysis Confirms Buy Signal Despite 2M Exchange Inflows – Crypto News
-

 Technology7 days ago
Not Google or Bing! This search engine lets you block AI images in search results – Crypto News
-
Cryptocurrency7 days ago
GENIUS Act Is The Catalyst For XRP And RLUSD’s Dominance, Expert Declares – Crypto News
-

 De-fi6 days ago
Nasdaq Files to Add Staking to BlackRock’s ETH ETF – Crypto News
-

 others5 days ago
EUR/CHF rises on speculation of SNB intervention, but EU–US trade risks cap gains – Crypto News
-

 Blockchain5 days ago
To The Moon? Justin Sun To Be Launched Into Space After $28M Bid – Crypto News