


others
Bull flag, upbeat China data and pre-RBA positioning highlight 0.6750 for buyers – Crypto News
- AUD/USD extends recovery from intraday low within bullish chart formation.
- China Caixin PMI, Australia TD Securities Inflation came in firmer for May.
- Sustained trading beyond key moving averages, upbeat RSI hints at confirmation of bullish pattern.
- Bull flag signals theoretical target of 0.6750, sellers need validation from 200-SMA.
AUD/USD picks up bids to pare intraday losses around 0.6700 as it struggles to cheer upbeat catalysts at home amid early Monday in Europe. In doing so, the Aussie pair portrays the traders’ anxiety ahead of the key Reserve Bank of Australia (RBA) data.
That said, strong US Nonfarm Payrolls (NFP) teased Aussie pair sellers during the week-start trading before the firmer Australia-China data recall the buyers. Earlier in the day, China’s Caixin Services PMI matches 57.1 market forecasts for May versus 56.4 previous readings. Before that, Australia’s TD Securities Inflation rose 0.9% MoM in May versus 0.2%. However, the downbeat prints of the TD Securities Inflation on a YoY basis join a reduction in the nation’s Corporate Gross Operating Profits for the first quarter (Q1) to prod the bulls.
Apart from that, the top line of the short-term bull flag, around 0.67000 round figure by the press time, challenges the AUD/USD pair buyers.
However, the Aussie pair’s successful trading above the 200 and 100 SMAs, as well as a three-day-old rising support line, keeps the pair buyers hopeful of crossing the immediate 0.6700 hurdle, which in turn highlights a theoretical run-up towards the 0.6750 marks.
During the likely rise, highs marked on May 16 and 19, respectively near 0.6710 and 0.6675, can act as intermediate halts.
Meanwhile, the 100-SMA joins the stated flag’s bottom line to highlight the 0.6580 level as the short-term key support.
Following that, the ascending support line from the last Wednesday, near 0.6570, followed by the 200-SMA level of near 0.6545, can act as the last defense of the AUD/USD bulls.
AUD/USD: 30-Minutes chart
Trend: Further upside expected


-

 Blockchain6 days ago
Ethereum Price Performance Could Hinge On This Binance Metric — Here’s Why – Crypto News
-
 Blockchain1 week ago
American Rapper Cardi B Endorses WAP Token Again—But Is It A Rugpull? – Crypto News
-

 Technology1 week ago
Best water purifiers under ₹15000: Explore the top 6 options from Aquaguard, Urban Company and more – Crypto News
-
 Cryptocurrency1 week ago
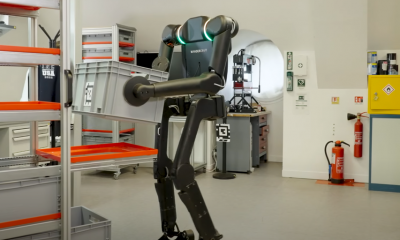
French Exoskeleton Company Wandercraft Pivots to Humanoid Robots – Crypto News
-
Cryptocurrency1 week ago
French Exoskeleton Company Wandercraft Pivots to Humanoid Robots – Crypto News
-

 Technology1 week ago
Final Fantasy Tactics returns once again with remastered edition – The Ivalice Chronicles; all details here – Crypto News
-

 Blockchain1 week ago
JPMorgan to Accept Bitcoin ETFs as Loan Collateral – Crypto News
-

 Cryptocurrency1 week ago
Trump-Elon feud Erupts, Crypto falls, Coinbase to list Fartcoin – Crypto News
-

 others1 week ago
Canadian Dollar gives back gains despite upbeat jobs data – Crypto News
-

 others5 days ago
Gold price in India: Rates on June 10 – Crypto News
-

 Technology1 week ago
Why Anthropic CEO Dario Amodei thinks a 10-year AI regulation freeze is dangerous – Crypto News
-

 Cryptocurrency1 week ago
Donald Trump Ready to Ditch His Tesla Amid Musk Feud? (Report) – Crypto News
-

 Blockchain5 days ago
OpenLedger Invests $25 Million to Combat ‘Extractive’ AI Economy – Crypto News
-

 others1 week ago
Gold prices fall as the USD extends gains post NFP – Crypto News
-

 Technology7 days ago
Gemini can now schedule tasks, send reminders and keep you on track: Here’s how it works – Crypto News
-

 Technology7 days ago
Best juicer for home in 2025: Top 10 choices for your family’s good health from brands like Philips, Borosil and more – Crypto News
-

 Cryptocurrency6 days ago
TRON: Who’s fueling TRX’s breakout? It’s not whales, here’s the answer! – Crypto News
-

 Technology3 days ago
Circle IPO shows strong crypto market investor demand – Crypto News
-

 Technology1 week ago
Microsoft integrates AI shopping into Copilot app, bringing price tracking and smart comparisons – Crypto News
-

 Technology6 days ago
How artificial intelligence caught leukaemia in Maharashtra’s Parbhani – Crypto News
-

 Technology6 days ago
OpenAI CEO Sam Altman says AI is like an intern today, but it will soon match experienced software engineers – Crypto News
-

 Cryptocurrency1 week ago
Best crypto to buy as Truth Social files for a Spot Bitcoin ETF – Crypto News
-

 others1 week ago
XAG/USD remains positive, supported above $34.00 – Crypto News
-
Technology1 week ago
The Quiet Voices Questioning China’s AI Hype – Crypto News
-

 others1 week ago
EUR/USD retreats from multi-week highs ahead of Eurozone GDP and consumption data – Crypto News
-
![Stacks [STX] down 31% after Alex Protocol exploit - Details](https://dripp.zone/news/wp-content/uploads/2025/06/Stacks-STX-down-31-after-Alex-Protocol-exploit-Details.webp-400x240.webp)
![Stacks [STX] down 31% after Alex Protocol exploit - Details](https://dripp.zone/news/wp-content/uploads/2025/06/Stacks-STX-down-31-after-Alex-Protocol-exploit-Details.webp-80x80.webp) Cryptocurrency7 days ago
Cryptocurrency7 days agoStacks [STX] down 31% after Alex Protocol exploit – Details – Crypto News
-

 Technology7 days ago
Weekly Tech Recap: Resident Evil Requiem release date revealed, OnePlus 13s makes India debut and more – Crypto News
-

 Technology6 days ago
OnePlus 13s review: A near-perfect compact phone, minus a few flagship perks – Crypto News
-

 others1 week ago
USD/INR flat lines amid US Dollar demand, equity outflow – Crypto News
-

 others1 week ago
Bitcoin Could Crash by Double-Digit Percentage Points in a ‘Quick Move’ if This Support Level Fails, Warns Crypto Trader – Crypto News
-

 others1 week ago
Widely Followed Analyst Outlines Bullish Path for Bitcoin, Says BTC Will Battle Gold and ‘Never Look Back’ – Crypto News
-
Technology7 days ago
Best juicer for home in 2025: Top 10 choices for your family’s good health from brands like Philips, Borosil and more – Crypto News
-

 others6 days ago
New Yorkers Warned of Fake QR Codes Being Placed on Parking Meters That Steal Victims’ Payment Information – Crypto News
-

 Cryptocurrency5 days ago
Union completes trusted setup to pave the way for trustless cross-chain DeFi – Crypto News
-

 Technology5 days ago
iOS 26’s Liquid Glass redesign met with backlash from Apple users: ‘Please tone it down’ – Crypto News
-

 Technology4 days ago
Father’s Day 2025 gift ideas: Smartwatch, Bluetooth speaker and more – Crypto News
-

 Cryptocurrency1 week ago
Solo Miner Defies Odds After Mining Bitcoin Block Earning Over $330K – Crypto News
-

 Blockchain1 week ago
Maple Expands to Solana, Brings Yield-Bearing Stablecoin – Crypto News
-

 Metaverse1 week ago
The transformer birthed GenAI. Meet the man who built it – Crypto News
-

 others1 week ago
GBP/USD slips as strong US jobs data cools Fed rate cut bets – Crypto News
-

 Blockchain1 week ago
Deutsche Bank Considers Digital Asset Projects – Crypto News
-

 others1 week ago
S&P 500 reaches 6,000 for first time since February on NFP print – Crypto News
-

 Technology6 days ago
India targets indigenous 2nm, Nvidia-level GPU by 2030 – Crypto News
-

 others6 days ago
Analyst Says Bitcoin Has ‘Pretty Good’ Chance of Hitting Massive Price Target in 2026, Citing Three Technical Signals – Crypto News
-
Technology6 days ago
BP Puts AI at the Heart of Its Efforts to Boost Performance – Crypto News
-
Technology5 days ago
iOS 26’s Liquid Glass redesign met with backlash from Apple users: ‘Please tone it down’ – Crypto News
-
Technology5 days ago
iOS 26’s Liquid Glass redesign met with backlash from Apple users: ‘Please tone it down’ – Crypto News
-

 others5 days ago
Stock Market Pullback in Sight As Several of America’s Problems Still Remain, Warns Former JPMorgan Strategist – Crypto News
-
 Technology4 days ago
One Tech Tip: How to protect your 23andMe genetic data – Crypto News
-

 others1 week ago
The Future of Non-Custodial Models in a Post-Coinbase World – Crypto News