


others
Bullish momentum sustains, potential correction looms on overbought conditions – Crypto News
- The daily chart flashes overbought signals but the overall trend favors the bulls.
- Post achieving multi-year highs over 96.70, NZD/JPY shows a possibility for a healthy technical correction.
- The pair has a strong support level at 95.00, a crucial point for buyers to defend to contain potential losses.
On Tuesday’s session, the NZD/JPY pair rose to 96.62 it highest level since July 2007. The outlook has shifted to cautious, with signs of a possible reversal in momentum as indicators flash overbought signals, but the overall bullish outlook remains intact.
Based on the daily chart indicators, the Relative Strength Index (RSI) consistently reflects overbought conditions standing deep in the overbought threshold. This hints at a potential downward price correction. Concurrently, the Moving Average Convergence Divergence (MACD) evidences continued positive momentum with its flat green bars.
NZD/JPY daily chart
Looking at the hourly chart, the RSI demonstrates lower strength compared to the daily view and has already started to edge downwards. In line with that, the MACD histogram suggests negative momentum as revealed by the presence of red bars.
NZD/JPY hourly chart
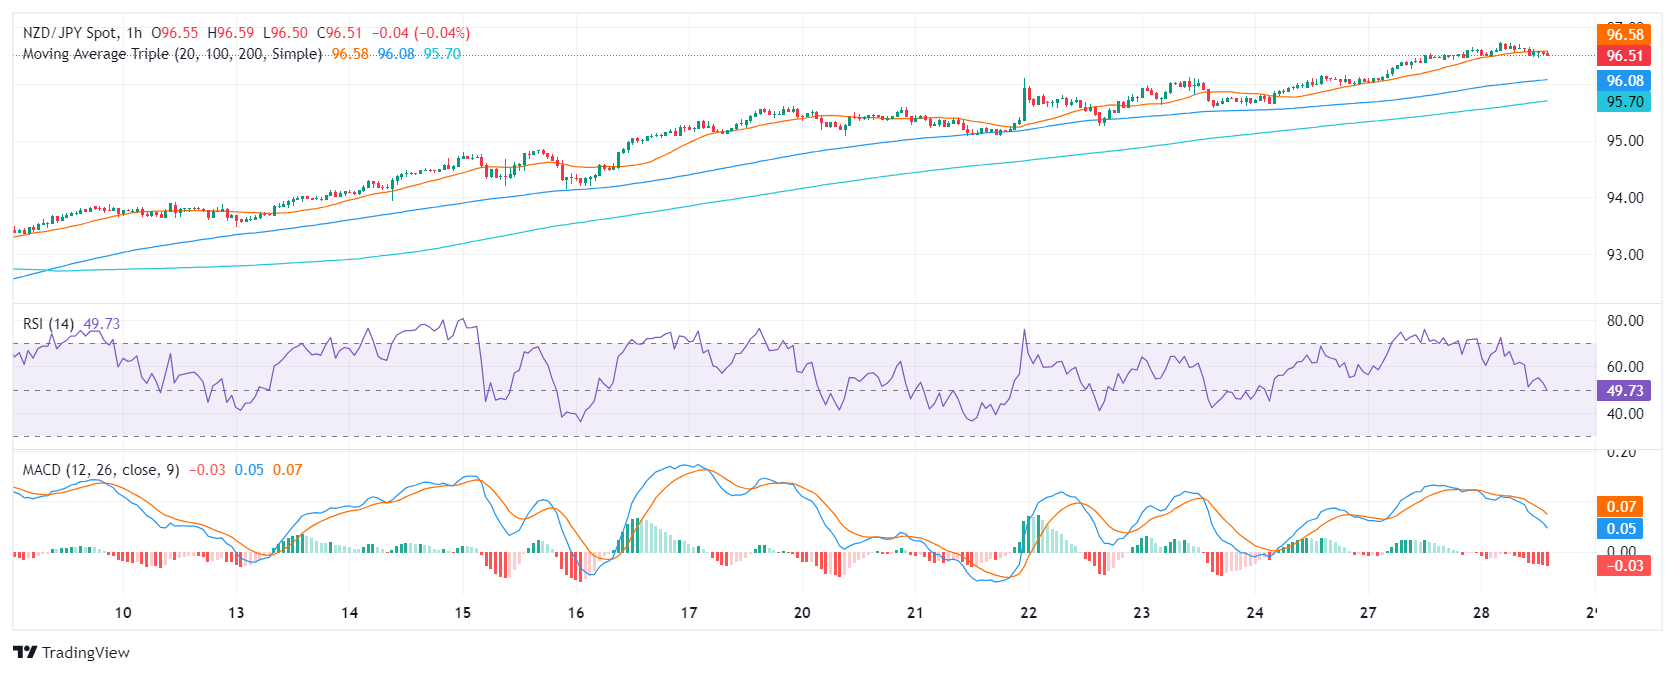
In the broader context, the NZD/JPY presently exhibits a strong uptrend, as displayed by its position above the 20, 100, and 200-day Simple Moving Averages (SMA). This indicates that the currency pair’s short-term gains are exceeding both its medium and long-term averages.
As a correction looms, any downward movements that keep the pair above its SMAs could be considered corrective, with the first strong support seen at around 95.00.


-

 Cryptocurrency1 week ago
Stripe’s stablecoin biz seeks national bank trust charter – Crypto News
-

 Technology1 week ago
Apple launches MacBook Pro 14-inch with M5 chip in India, price starts at ₹1,69,900 – Crypto News
-

 Metaverse1 week ago
Tech is valued as if AI is the next smartphone. It isn’t. – Crypto News
-

 Technology6 days ago
ChatGPT remains the most popular chatbot globally but Google’s Gemini is catching up fast – Crypto News
-
Business1 week ago
Nasdaq-Listed Webus Adopts XRP in New Tokenized Reward Platform, Eyes $20B Loyalty Market – Crypto News
-
Business1 week ago
Dogecoin Gets Major Utility Boost as Trump-Linked Thumzup Prepares DOGE Payments – Crypto News
-
others5 days ago
‘Floki Is The CEO’: FLOKI Surges Over 20% After Elon Musk’s Name Drop – Crypto News
-

 Cryptocurrency1 week ago
Why Are These Ripple (XRP) ETF Filings the Worst Idea Ever? Analyst Explains – Crypto News
-
Business1 week ago
Fed’s Stephen Miran Calls for Rapid Rate Cuts Amid U.S.-China Trade Tensions – Crypto News
-

 Cryptocurrency1 week ago
Is Wave 5 Still Coming or a New Bull Trend Emerging? – Crypto News
-
Technology1 week ago
XRP News: Ripple Strikes Deal with Absa, Expanding Custody Footprint To Africa – Crypto News
-
Business1 week ago
Pi Coin Price Gears for Recovery as DEX and AMM Launch Revives Utility Hopes – Crypto News
-
others1 week ago
Cardano’s Charles Hoskinson Addresses Allegations of Diverting Treasury Funds – Crypto News
-

 others5 days ago
Risk-off sentiment drives selective equity positioning – BNY – Crypto News
-

 others5 days ago
AUD/USD rises on US-China trade hopes, Fed rate cut outlook – Crypto News
-
others4 days ago
Ethereum Price Targets $8K Amid John Bollinger’s ‘W’ Bottom Signal and VanEck Staked ETF Filing – Crypto News
-

 Metaverse1 week ago
Mint Explainer | Why Big Tech is rushing to build AI data centres across India – Crypto News
-

 Metaverse1 week ago
ChatGPT ‘adult model’ plan: OpenAI’s Sam Altman reacts to criticism, says ‘not elected moral police’ – Crypto News
-

 Blockchain1 week ago
Visa Says Stablecoins Are Powering ‘a New Lending Space’ – Crypto News
-
Business1 week ago
Building Through the Downturn – Why Smart Money Is Watching XYZVerse – Crypto News
-
Business1 week ago
Gold vs Bitcoin – Peter Schiff Declares BTC Has Failed as Digital Gold, CZ Reacts – Crypto News
-

 Blockchain1 week ago
Ghana Moves Toward Crypto Regulation Amid Rising User Adoption – Crypto News
-

 Metaverse1 week ago
All About AI Tech4Good Awards are back for the second edition. Apply Now! – Crypto News
-

 Cryptocurrency1 week ago
Crypto markets turn red after Trump threatens to halt cooking oil imports from China – Crypto News
-
others6 days ago
Shiba Inu Price Eyes Recovery as Burn Rate Jumps 10,785% – Can SHIB Hit $0.000016? – Crypto News
-

 Blockchain6 days ago
Trump Confirms Meeting With Xi Jinping on Oct 31, Markets Rally in Response – Crypto News
-
Business5 days ago
How Will “Unusual” US CPI Inflation Data Release Could Impact Fed Rate Cut, Crypto Market? – Crypto News
-

 Technology5 days ago
AWS says it has fixed the problem that crippled half the internet but many popular apps are still down – Crypto News
-
Business5 days ago
Binance Founder CZ Predicts Bitcoin Will Flip Gold’s $30 Trillion Market – Crypto News
-

 Technology5 days ago
Amazon Web Services outage: Here’s how many users are impacted and the downtime costs – Crypto News
-
Business4 days ago
Solana Price Eyes $240 Recovery as Gemini Launches SOL-Reward Credit Card – Crypto News
-

 Cryptocurrency1 week ago
Coinbase Plans to List Surging BNB After Previously Delisting Binance Stablecoin – Crypto News
-
![Nifty 50 Index Elliott Wave technical analysis [Video]](https://dripp.zone/news/wp-content/uploads/2025/05/Nifty-50-Index-Elliott-Wave-technical-analysis-Video-Crypto-400x240.jpg)
![Nifty 50 Index Elliott Wave technical analysis [Video]](https://dripp.zone/news/wp-content/uploads/2025/05/Nifty-50-Index-Elliott-Wave-technical-analysis-Video-Crypto-80x80.jpg) others1 week ago
others1 week agoDow Jones holds onto recovery levels as investors focus on earnings – Crypto News
-

 De-fi1 week ago
Crypto Market Slides for Second Day as Bitcoin Dips Amid Geopolitical Tensions – Crypto News
-

 Cryptocurrency1 week ago
How to Create A Meme Coin For Free On Solana – Crypto News
-

 De-fi1 week ago
Lighter Distributes Points to Users Affected by Platform Outage – Crypto News
-

 De-fi1 week ago
Sony Enters U.S. Crypto Banking Race Amid Growing Institutional Interest – Crypto News
-
Business1 week ago
BlackRock Dumps Bitcoin and Adds Ethereum Amid Crypto Market Crash – Crypto News
-

 others1 week ago
USD/JPY strengthens as Trump’s softer stance on China boosts US Dollar demand – Crypto News
-
others7 days ago
Stripe-backed Tempo Hires Ethereum Researcher Dankrad Feist After $500M Funding – Crypto News
-

 others7 days ago
Gold crashes 2% from record high as Trump tempers threats on China – Crypto News
-

 Cryptocurrency7 days ago
Ethena (ENA) Price Outperforming: Only Reason – Crypto News
-

 Technology6 days ago
Perplexity AI tops app charts on Google Play Store and Apple App Store, outpaces ChatGPT and Gemini – Crypto News
-
 others6 days ago
We should not cut rates every quarter, but rate-cutting cycle not over – Crypto News
-

 Cryptocurrency5 days ago
Aster price tanks 20% as sell-off pressure hits altcoins – Crypto News
-
others5 days ago
Data Shows Bitcoin Short Squeeze Likely With Speculation of “Bullish” US CPI – Crypto News
-

 others5 days ago
Australian Dollar pares gains as US Dollar steadies on easing US-China tensions – Crypto News
-
others5 days ago
BREAKING: 21Shares Amends S-1 for Spot Dogecoin ETF Approval – Crypto News
-

 De-fi5 days ago
DeFi Earning Aggregator Turtle Raises $5.5 Million – Crypto News
-
others4 days ago
Analyst Predicts $10k ETH Price as Vitalik Buterin Launches Major Upgrade for Faster Proofs Systems – Crypto News