


others
Canadian Dollar churns on Monday, BoC CPI inflation around the corner – Crypto News
- Canadian Dollar mostly higher but flat against Greenback again.
- Canada brings BoC CPI inflation to the table on Tuesday.
- Fedspeak dominates headlines, CAD volumes thin on holiday Monday.
The Canadian Dollar (CAD) was broadly higher on Monday before a moderating pullback halfway through the American trading session. Momentum remains limited with Canadian markets shuttered for the Victoria Day holiday. CAD traders will officially kick the trading week off on Tuesday, just in time for the Bank of Canada’s (BoC) latest Consumer Price Index (CPI) inflation.
Canada is taking the day off, leaving Fedspeak the key market force on Monday as Federal Reserve (Fed) officials make a slew of appearances. Fed policymakers are walking a fine line between hawkish and bullish as the US central bank tries to balance sky-high market expectations for rate cuts with a mixed data outlook. The Fed remains concerned that inflation could remain a tricky problem to solve, but investors are adamant that the Fed is due for a first rate cut in September.
Daily digest market movers: Canadian Dollar finds room to grow, but limited against Greenback
- Canadian Dollar recovers ground, but Greenback takes top spot on Monday, climbing higher and further.
- Fed speakers flood the newswires on Monday, stressing the need for patience on rate moves with inflation expected by Fed staff to remain too high for too long.
- Canada’s CPI inflation for the year ended April is expected to tick down to 2.7% from 2.9%.
- The BoC’s own Core CPI inflation tracker last came in at 2.0% YoY.
- Tuesday will feature even more Fed appearances, filling investors’ viewports.
- Fed officials speak cautiously on policy outlook after April inflation report
Canadian Dollar PRICE Today
The table below shows the percentage change of Canadian Dollar (CAD) against listed major currencies today. Canadian Dollar was the strongest against the New Zealand Dollar.
| USD | EUR | GBP | JPY | CAD | AUD | NZD | CHF | |
|---|---|---|---|---|---|---|---|---|
| USD | 0.03% | -0.08% | 0.30% | 0.02% | 0.28% | 0.36% | 0.02% | |
| EUR | -0.03% | -0.15% | 0.31% | -0.01% | 0.28% | 0.34% | -0.01% | |
| GBP | 0.08% | 0.15% | 0.32% | 0.14% | 0.42% | 0.47% | 0.13% | |
| JPY | -0.30% | -0.31% | -0.32% | -0.29% | -0.01% | 0.08% | -0.27% | |
| CAD | -0.02% | 0.00% | -0.14% | 0.29% | 0.22% | 0.34% | 0.00% | |
| AUD | -0.28% | -0.28% | -0.42% | 0.01% | -0.22% | 0.05% | -0.29% | |
| NZD | -0.36% | -0.34% | -0.47% | -0.08% | -0.34% | -0.05% | -0.34% | |
| CHF | -0.02% | 0.00% | -0.13% | 0.27% | -0.00% | 0.29% | 0.34% |
The heat map shows percentage changes of major currencies against each other. The base currency is picked from the left column, while the quote currency is picked from the top row. For example, if you pick the Canadian Dollar from the left column and move along the horizontal line to the US Dollar, the percentage change displayed in the box will represent CAD (base)/USD (quote).
Technical analysis: Canadian Dollar high, but Greenback even higher
The Canadian Dollar (CAD) gained ground against nearly all of its major currency peers, but buying pressure evaporated, leaving the CAD in middle ground on Monday. On the low side, the CAD shed around a tenth of a percent against the market’s Monday top performers, the Pound Sterling (GBP) and the US Dollar (USD).
USD/CAD continues to go sideways in the near term, treading choppy water between 1.3640 and the 1.3600 handle. Intraday price action remains hampered by the 200-hour Exponential Moving Average (EMA) at 1.3646.
Middling technical action threatens to bake into USD/CAD with daily candlesticks stuck between the 50-day and 200-day EMAs at 1.3635 and 1.3548, respectively. The 1.3600 handle remains a key technical barrier, acting as a magnet pulling down bullish momentum and a price floor hobbling further shortside progress.
USD/CAD hourly chart
USD/CAD daily chart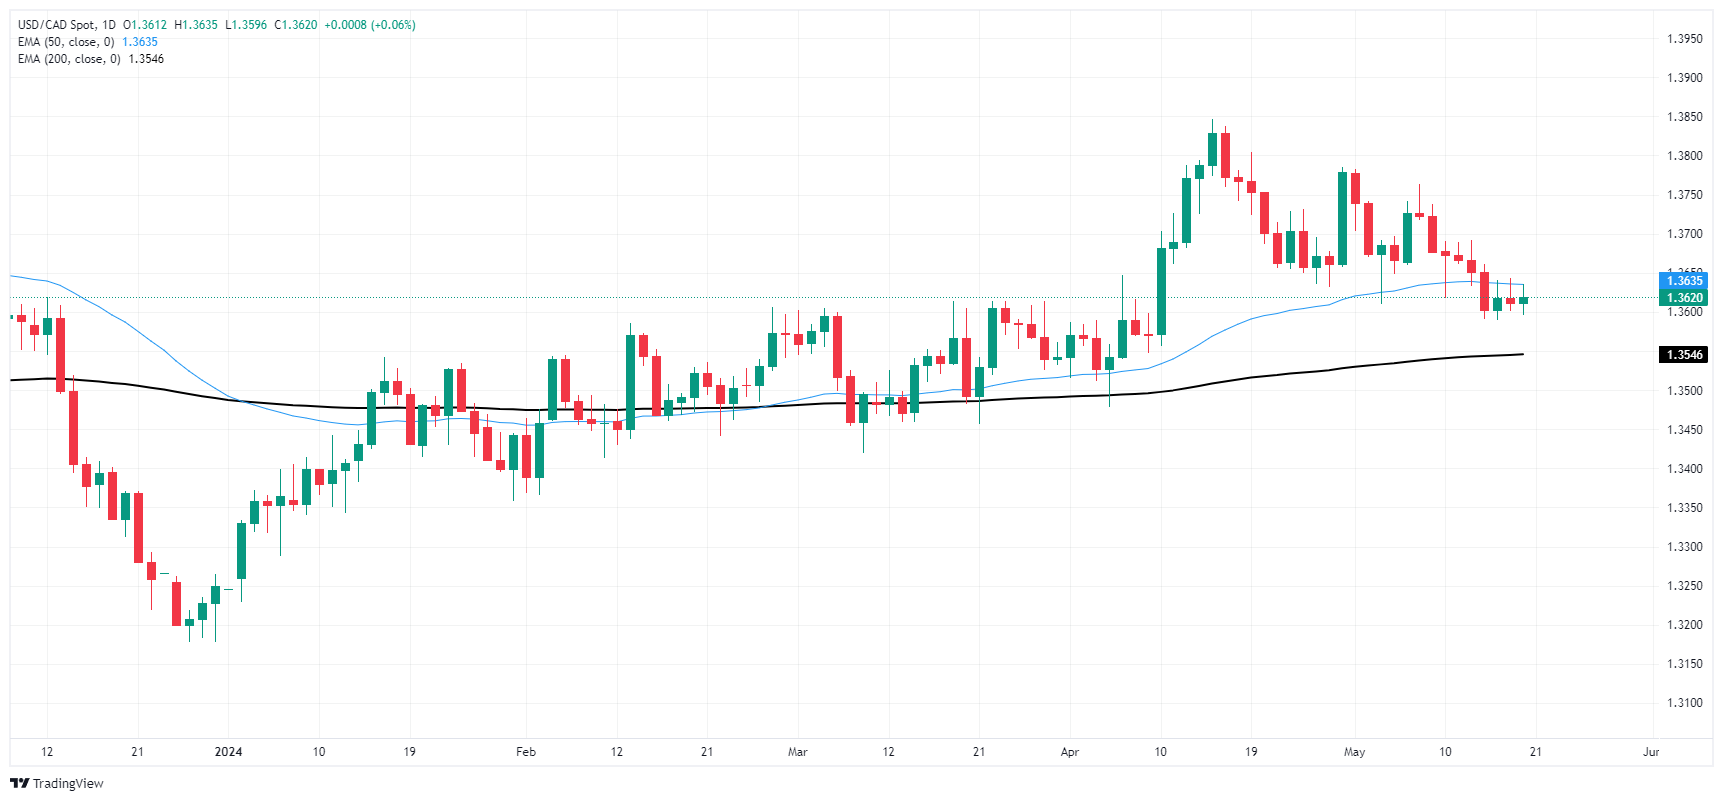
Fed FAQs
Monetary policy in the US is shaped by the Federal Reserve (Fed). The Fed has two mandates: to achieve price stability and foster full employment. Its primary tool to achieve these goals is by adjusting interest rates. When prices are rising too quickly and inflation is above the Fed’s 2% target, it raises interest rates, increasing borrowing costs throughout the economy. This results in a stronger US Dollar (USD) as it makes the US a more attractive place for international investors to park their money. When inflation falls below 2% or the Unemployment Rate is too high, the Fed may lower interest rates to encourage borrowing, which weighs on the Greenback.
The Federal Reserve (Fed) holds eight policy meetings a year, where the Federal Open Market Committee (FOMC) assesses economic conditions and makes monetary policy decisions. The FOMC is attended by twelve Fed officials – the seven members of the Board of Governors, the president of the Federal Reserve Bank of New York, and four of the remaining eleven regional Reserve Bank presidents, who serve one-year terms on a rotating basis.
In extreme situations, the Federal Reserve may resort to a policy named Quantitative Easing (QE). QE is the process by which the Fed substantially increases the flow of credit in a stuck financial system. It is a non-standard policy measure used during crises or when inflation is extremely low. It was the Fed’s weapon of choice during the Great Financial Crisis in 2008. It involves the Fed printing more Dollars and using them to buy high grade bonds from financial institutions. QE usually weakens the US Dollar.
Quantitative tightening (QT) is the reverse process of QE, whereby the Federal Reserve stops buying bonds from financial institutions and does not reinvest the principal from the bonds it holds maturing, to purchase new bonds. It is usually positive for the value of the US Dollar.


-

 Technology4 days ago
ChatGPT users are mass cancelling OpenAI subscriptions after GPT-5 launch: Here’s why – Crypto News
-
Technology1 week ago
Binance to List Fireverse (FIR)- What You Need to Know Before August 6 – Crypto News
-

 Technology1 week ago
Best computer set under ₹20000 for daily work and study needs: Top 6 affordable picks students and beginners – Crypto News
-
Technology1 week ago
Beyond Billboards: Why Crypto’s Future Depends on Smarter Sports Sponsorships – Crypto News
-

 Technology1 week ago
Google DeepMind CEO Demis Hassabis explains why AI could replace doctors but not nurses – Crypto News
-
 others1 week ago
Bank of America CEO Denies Alleged Debanking Trend, Says Regulators Need To Provide More Clarity To Avoid ‘Second-Guessing’ – Crypto News
-
others1 week ago
Japan CFTC JPY NC Net Positions down to ¥89.2K from previous ¥106.6K – Crypto News
-

 Cryptocurrency1 week ago
How to Trade Meme Coins in 2025 – Crypto News
-
Business1 week ago
Analyst Spots Death Cross on XRP Price as Exchange Inflows Surge – Is A Crash Ahead ? – Crypto News
-
others1 week ago
Pi Network Invests In OpenMiind’s $20M Vision for Humanoid Robots- Is It A Right Move? – Crypto News
-
Business1 week ago
Pi Network Invests In OpenMiind’s $20M Vision for Humanoid Robots- Is It A Right Move? – Crypto News
-

 De-fi1 week ago
TON Sinks 7.6% Despite Verb’s $558M Bid to Build First Public Toncoin Treasury Firm – Crypto News
-
Cryptocurrency4 days ago
DWP Management Secures $200M in XRP Post SEC-Win – Crypto News
-
Business1 week ago
Is Quantum Computing A Threat for Bitcoin- Elon Musk Asks Grok – Crypto News
-

 Technology1 week ago
Elon Musk reveals why AI won’t replace consultants anytime soon—and it’s not what you think – Crypto News
-

 others1 week ago
Is Friday’s sell-off the beginning of a downtrend? – Crypto News
-

 Technology1 week ago
Oppo K13 Turbo, K13 Turbo Pro to launch in India on 11 August: Expected price, specs and more – Crypto News
-
Blockchain1 week ago
Shiba Inu Team Member Reveals ‘Primary Challenge’ And ‘Top Priority’ Amid Market Uncertainty – Crypto News
-

 Technology1 week ago
OpenAI releases new reasoning-focused open-weight AI models optimised for laptops – Crypto News
-

 Blockchain1 week ago
Crypto Market Might Be Undervalued Amid SEC’s New Stance – Crypto News
-

 Metaverse1 week ago
ChatGPT won’t help you break up anymore as OpenAI tweaks rules – Crypto News
-

 De-fi6 days ago
Coinbase Pushes for ZK-enabled AML Overhaul Just Months After Data Breach – Crypto News
-

 Technology4 days ago
Humanoid Robots Still Lack AI Technology, Unitree CEO Says – Crypto News
-

 others1 week ago
Visa and Mastercard’s Payment Dominance Not Threatened by Stablecoins, According to Execs – Crypto News
-
Business1 week ago
Breaking: U.S. CFTC Kicks off Crypto Sprint, Explores Spot and Futures Trading Together – Crypto News
-

 Cryptocurrency1 week ago
Lido Slashes 15% of Staff, Cites Operational Cost Concerns – Crypto News
-
others1 week ago
MetaPlanet Launches Online Clothing Store As Part of ‘Brand Strategy’ – Crypto News
-

 Technology1 week ago
iPhone users alert! Truecaller to discontinue call recording feature for iOS from September 30. Here’s what you can do… – Crypto News
-
Technology1 week ago
iPhone users alert! Truecaller to discontinue call recording feature for iOS from September 30. Here’s what you can do… – Crypto News
-

 others7 days ago
US President Trump issues executive order imposing additional 25% tariff on India – Crypto News
-
Business7 days ago
Analyst Predicts $4K Ethereum Rally as SEC Clarifies Liquid Staking Rules – Crypto News
-

 De-fi7 days ago
SEC Says Some Stablecoins Can Be Treated as Cash, but Experts Warn of Innovation Risk – Crypto News
-
Business6 days ago
XRP Price Prediction As $214B SBI Holdings Files for XRP ETF- Analyst Sees Rally to $4 Ahead – Crypto News
-

 others6 days ago
EUR firmer but off overnight highs – Scotiabank – Crypto News
-

 Blockchain6 days ago
Trump to Sign an EO Over Ideological Debanking: Report – Crypto News
-

 De-fi6 days ago
Ripple Expands Its Stablecoin Payments Infra with $200M Rail Acquisition – Crypto News
-

 others5 days ago
Ripple To Gobble Up Payments Platform Rail for $200,000,000 To Support Transactions via XRP and RLUSD Stablecoin – Crypto News
-
 Cryptocurrency5 days ago
Harvard Reveals $116 Million Investment in BlackRock Bitcoin ETF – Crypto News
-
others4 days ago
SEC Latest Filing Reveal Ripple Case Win Could Trigger XRP Treasury Boom Like Ethereum – Crypto News
-
others1 week ago
United States CFTC Oil NC Net Positions climbed from previous 153.3K to 156K – Crypto News
-

 De-fi1 week ago
Ripple CTO Admits ‘Even Ripple Can’t Use XRPL DEX’ as XRP Faces Longtime Fan’s Scrutiny – Crypto News
-

 Technology1 week ago
Infinix GT 30 5G+ confirmed to launch in India on 8 August: Expected price, specs and more – Crypto News
-

 De-fi1 week ago
Ethereum Turns 10: Experts Say ETH Could Hit $40,000 in Next Decade as Network Matures – Crypto News
-

 Blockchain1 week ago
GENIUS Act Could Limit Stablecoin Appeal Amid Tokenization Boom – Crypto News
-

 Blockchain1 week ago
Trump CFTC Pick Brian Quintenz Questioned On Kalshi Ties – Crypto News
-

 Technology1 week ago
Solo Bitcoin miners keep winning against long odds – Crypto News
-

 Cryptocurrency1 week ago
Crypto Rises Alongside Stocks as Fed Pivot Bets Build – Crypto News
-
 Blockchain1 week ago
Bitcoin Uptrend Over? This Week’s Price Action May Hold The Key – Crypto News
-
Business1 week ago
Trump Says He May Announce Fed Chair Powell’s Replacement “Fairly Soon” – Crypto News
-

 Blockchain1 week ago
SEC Says Certain Liquid Staking Activities Fall Outside of Securities Laws – Crypto News