


others
Canadian Dollar falls back against Greenback on Thursday as buck bets rebound – Crypto News
- Canadian Dollar rises, but USD rises faster.
- Canada brings Retail Sales data to fore on Friday.
- US PMIs came in mixed on Thursday.
The Canadian Dollar (CAD) is broadly higher on Thursday, climbing against most of its major currency peers, but the US Dollar (USD) is getting bid higher, faster. Investors are paring back Greenback selling after a Fed-fueled midweek splurge, bolstering the US Dollar across the board.
Canada will return to the economic calendar with meaningful data on Friday. Retail Sales figures for January are expected to decline around half a percent after rising nearly a full percent in December.
Daily digest market movers: US Dollar dominates on US data flows
- US S&P Global Purchasing Managers Index (PMI) figures printed a split on Thursday.
- March’s US Manufacturing PMI rose to 52.5 from the previous 52.2, easily vaulting over the forecasted decline to 51.7.
- The Services PMI for March fell more than expected, declining to 51.7 from the previous month’s 52.3, falling more than the forecast 52.0.
- US Initial Jobless Claims slipped to 210K for the week ended March 15, missing the forecasted increase to 215K from the previous week’s 212K (revised upward from 209K).
- Analysts from Scotiabank have noted that the month of April tends to be the Canadian Dollar’s best-performing month against the Greenback.
- Scotiabank: April is the CAD’s best month of the calendar year against the USD
Canadian Dollar price today
The table below shows the percentage change of Canadian Dollar (CAD) against listed major currencies today. Canadian Dollar was the weakest against the US Dollar.
| USD | EUR | GBP | CAD | AUD | JPY | NZD | CHF | |
| USD | 0.71% | 1.03% | 0.45% | 0.39% | 0.61% | 0.71% | 1.50% | |
| EUR | -0.72% | 0.32% | -0.26% | -0.33% | -0.12% | 0.01% | 0.79% | |
| GBP | -1.05% | -0.33% | -0.59% | -0.63% | -0.45% | -0.32% | 0.46% | |
| CAD | -0.47% | 0.26% | 0.59% | -0.05% | 0.13% | 0.26% | 1.04% | |
| AUD | -0.40% | 0.32% | 0.64% | 0.06% | 0.19% | 0.33% | 1.10% | |
| JPY | -0.58% | 0.13% | 0.45% | -0.16% | -0.19% | 0.14% | 0.91% | |
| NZD | -0.71% | 0.00% | 0.32% | -0.26% | -0.33% | -0.10% | 0.80% | |
| CHF | -1.51% | -0.79% | -0.47% | -1.06% | -1.12% | -0.90% | -0.80% |
The heat map shows percentage changes of major currencies against each other. The base currency is picked from the left column, while the quote currency is picked from the top row. For example, if you pick the Euro from the left column and move along the horizontal line to the Japanese Yen, the percentage change displayed in the box will represent EUR (base)/JPY (quote).
Technical analysis: US Dollar rebounds, bullish CAD gets outperformed
The Canadian Dollar (CAD) is broadly higher on Thursday, gaining ground against nearly all of its major currency peers despite falling around four-tenths of a percent against the US Dollar. The CAD is struggling to hold flat against the day’s other over-performing currency, the Australian Dollar (AUD).
The USD/CAD is on the rise in Thursday trading, cutting in approximately 0.6% in bullish momentum bottom-to-top. The pair caught a bounce from the 1.3460 region, reclaiming the familiar 1.3500 handle in intraday trading.
Thursday’s recovery etches in a technical rejection from the 200-day Simple Moving Average (SMA) at 1.3485. A rangebound USD/CAD pattern looks set to continue in the near term.
USD/CAD hourly chart
USD/CAD daily chart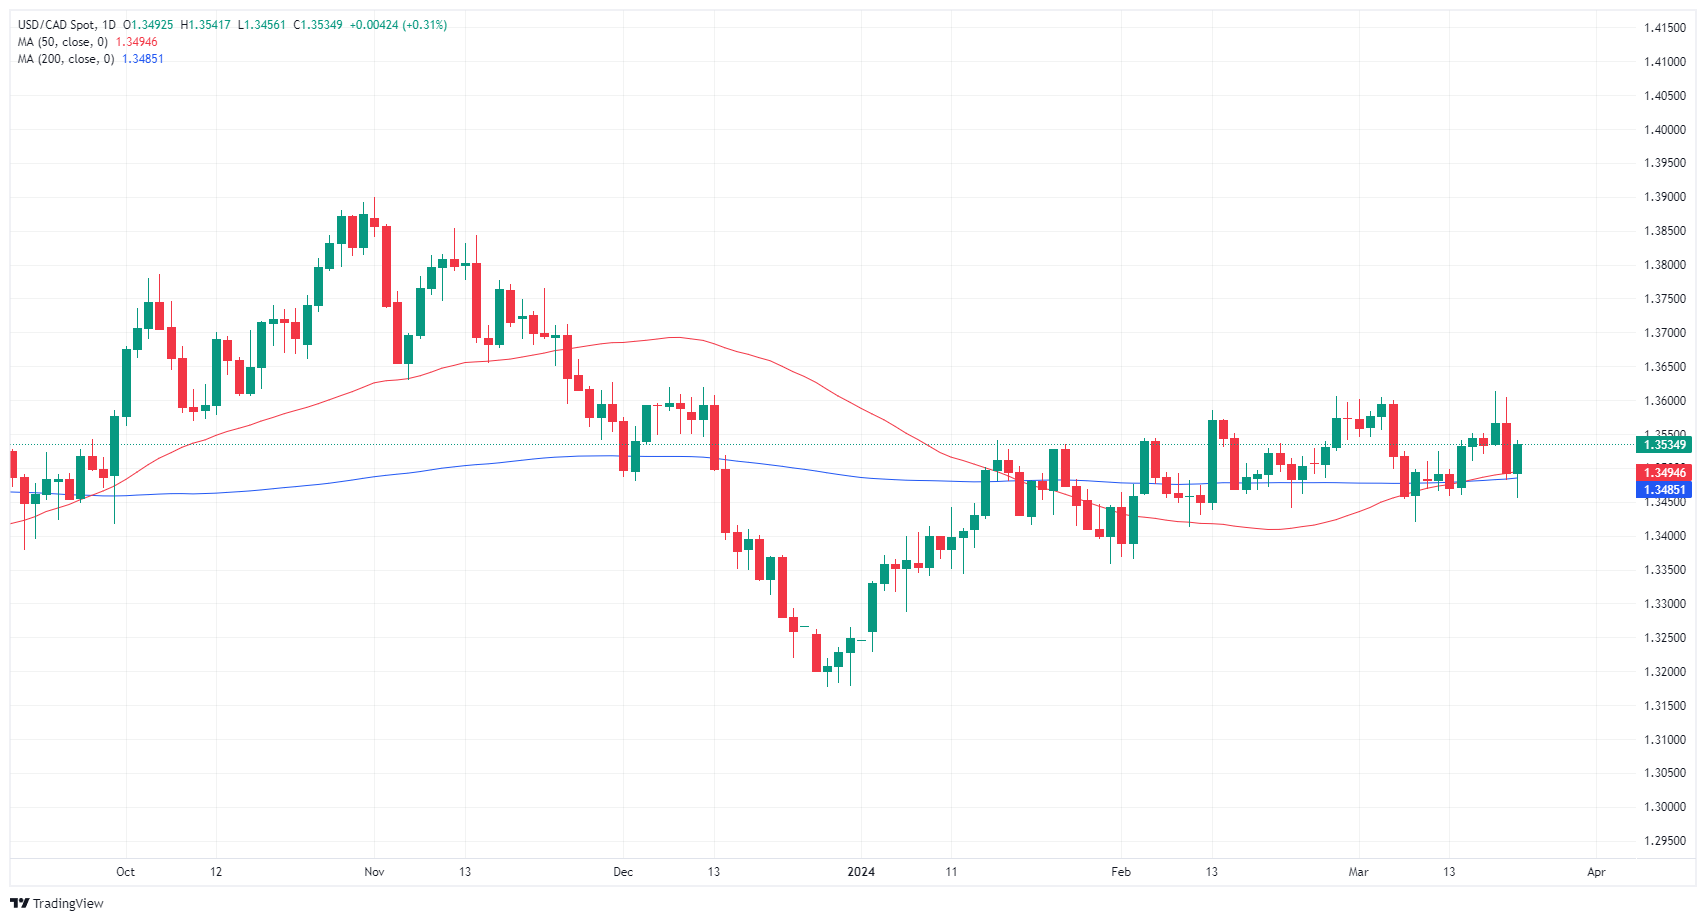
Inflation FAQs
Inflation measures the rise in the price of a representative basket of goods and services. Headline inflation is usually expressed as a percentage change on a month-on-month (MoM) and year-on-year (YoY) basis. Core inflation excludes more volatile elements such as food and fuel which can fluctuate because of geopolitical and seasonal factors. Core inflation is the figure economists focus on and is the level targeted by central banks, which are mandated to keep inflation at a manageable level, usually around 2%.
The Consumer Price Index (CPI) measures the change in prices of a basket of goods and services over a period of time. It is usually expressed as a percentage change on a month-on-month (MoM) and year-on-year (YoY) basis. Core CPI is the figure targeted by central banks as it excludes volatile food and fuel inputs. When Core CPI rises above 2% it usually results in higher interest rates and vice versa when it falls below 2%. Since higher interest rates are positive for a currency, higher inflation usually results in a stronger currency. The opposite is true when inflation falls.
Although it may seem counter-intuitive, high inflation in a country pushes up the value of its currency and vice versa for lower inflation. This is because the central bank will normally raise interest rates to combat the higher inflation, which attract more global capital inflows from investors looking for a lucrative place to park their money.
Formerly, Gold was the asset investors turned to in times of high inflation because it preserved its value, and whilst investors will often still buy Gold for its safe-haven properties in times of extreme market turmoil, this is not the case most of the time. This is because when inflation is high, central banks will put up interest rates to combat it. Higher interest rates are negative for Gold because they increase the opportunity-cost of holding Gold vis-a-vis an interest-bearing asset or placing the money in a cash deposit account. On the flipside, lower inflation tends to be positive for Gold as it brings interest rates down, making the bright metal a more viable investment alternative.


![Nifty 50 Index Elliott Wave technical analysis [Video]](https://dripp.zone/news/wp-content/uploads/2025/05/Nifty-50-Index-Elliott-Wave-technical-analysis-Video-Crypto-400x240.jpg)
![Nifty 50 Index Elliott Wave technical analysis [Video]](https://dripp.zone/news/wp-content/uploads/2025/05/Nifty-50-Index-Elliott-Wave-technical-analysis-Video-Crypto-80x80.jpg)
-

 Blockchain3 days ago
Crypto execs cheer as Australia appoints pro-crypto assistant minister – Crypto News
-

 Cryptocurrency1 week ago
BNBInfinity surpasses 420+ BNB in global deposits as DeFi investors rally around high-yield, transparent smart contract – Crypto News
-
Cryptocurrency1 week ago
BNBInfinity surpasses 420+ BNB in global deposits as DeFi investors rally around high-yield, transparent smart contract – Crypto News
-

 Blockchain1 week ago
Bitcoin Surpasses $100K Mark Amid New Trade Deal – Crypto News
-

 Business1 week ago
Rite Aid Files for Bankruptcy, Job Cuts Expected – Crypto News
-

 Blockchain1 week ago
$25 Million Pledge From Ripple Set To Benefit Teachers And Students Across The US – Crypto News
-
Business1 week ago
Bloomberg Analyst Alleges Binance Founder CZ’s Involvement in BNB ETF Filing – Crypto News
-
 Cryptocurrency1 week ago
Bitcoin: Odds of BTC breaking $97K in the face of profit-taking are… – Crypto News
-

 others3 days ago
Hackers Attempting To Extort School Employees via Email After Millions of Students’ Personal Data Leaked in Breach: Report – Crypto News
-
Business3 days ago
No Truth to Truth Social Memecoin: World Liberty Financial Clarifies – Crypto News
-
others2 days ago
Why Is Crypto Market Down When S&P 500 Flashes Bull Run Ahead? – Crypto News
-

 Blockchain1 week ago
Is Another Drop on the Horizon? – Crypto News
-

 Blockchain1 week ago
A Correction To This Level Could Come First – Crypto News
-
Business1 week ago
Bloomberg Analyst Alleges Binance Founder CZ’s Involvement in BNB ETF Filing – Crypto News
-

 others1 week ago
CAD steady just below Tuesday’s multimonth high – Scotiabank – Crypto News
-

 Blockchain1 week ago
XRP At Make-Or-Break Technical Zone, Crypto Analyst Warns – Crypto News
-
Blockchain1 week ago
XRP At Make-Or-Break Technical Zone, Crypto Analyst Warns – Crypto News
-

 Metaverse1 week ago
OpenAI’s flip-flop will not get Elon Musk off its back – Crypto News
-

 Blockchain6 days ago
Bitcoin yet to hit $150K because outsiders are ghosting — Michael Saylor – Crypto News
-
Technology4 days ago
Bitcoin Price Watch: $120,000 Rally Ahead as BlackRock Enters BTC Staking Discussion with SEC – Crypto News
-

 others3 days ago
Investor Kidnapped, Driven to Remote Desert and Robbed of $4,000,000 in Cryptocurrency by Teenagers: Report – Crypto News
-
 others1 week ago
US debt ceiling deadline expected late summer, but could come forward – Crypto News
-

 Technology1 week ago
OpenAI dials back conversion plan, nonprofit to retain control – Crypto News
-

 others1 week ago
Retail Traders Embracing ‘Gamble’ Mindset As Memecoin Discussions Hit Highest Level This Year, Warns Santiment – Crypto News
-

 others1 week ago
Euro steadies near 1.1300 with bullish bias intact – Crypto News
-

 Metaverse1 week ago
Elon Musk to keep lawsuit against OpenAI: Why Sam Altman’s non-profit control U-turn fails to cheer Tesla chief – Crypto News
-
Business1 week ago
Bitcoin Price Jumps to $96K As China Confirms Restart of US Trade Talks – Crypto News
-

 Blockchain1 week ago
Ethereum To ‘Witness Big Breakout’ In 2 Weeks If This Level Holds – Crypto News
-
 Cryptocurrency1 week ago
Florida scraps Bitcoin reserve bills as state-level crypto adoption faces setbacks – Crypto News
-

 Blockchain7 days ago
Ethereum Stuck Between Retail Sell-Off And Whale Accumulation, Analyst Explains – Crypto News
-

 Blockchain6 days ago
Bitcoin Reaches $103K as Funding Rate Turns Positive Post-Liquidations – Crypto News
-
Blockchain6 days ago
Bitcoin Reaches $103K as Funding Rate Turns Positive Post-Liquidations – Crypto News
-
Business3 days ago
Bitcoin Price Risks Dropping Below $100k As Crypto Liquidations Hit $714M – Crypto News
-

 others3 days ago
USD/JPY falls below 148.00 despite persistent uncertainty over BoJ’s policy outlook – Crypto News
-
others3 days ago
Pepe Coin Price Outperforms DOGE and SHIB, Targets 80% Upside Post-Retest – Crypto News
-

 Blockchain3 days ago
Top Expert Declares It The Best Crypto To Buy Now – Crypto News
-
Business3 days ago
Crypto News: Animoca Brands Eye NYSE Listing Amid Donald Trump’s Crypto Push – Crypto News
-

 others2 days ago
MoonX: BYDFi’s On-Chain Trading Engine — A Ticket from CEX to DEX – Crypto News
-
Business1 week ago
Pi Network Price Analysis: 3 Reasons Why Binance is Not Listing Pi Coin – Crypto News
-

 Cryptocurrency1 week ago
Haliey ‘Hawk Tuah’ Welch Feels ‘Sorry’ For Victims of Meme Coin Scandal – Crypto News
-

 Technology1 week ago
Jio extends ‘Unlimited’ offer till IPL 2025 final: Free Hotstar, data and more – Crypto News
-

 Technology1 week ago
Jio extends ‘Unlimited’ offer till IPL 2025 final: Free Hotstar, data and more – Crypto News
-

 Technology1 week ago
How slow enterprise blockchain adoption presents opportunities – Crypto News
-

 others1 week ago
Arthur Hayes Says Setup Is Perfect for 2022-Style Rally in Risk Assets Amid Fear and Uncertainty – Crypto News
-

 Cryptocurrency1 week ago
Visa Bets on Stablecoin Demand With Investment in BVNK – Crypto News
-

 Technology1 week ago
Google uncovers ‘LOSTKEYS’ malware linked to Russian-backed Cold River hackers – Crypto News
-

 others1 week ago
Messaging App Used by Trump Admin Hacked – Attacker May Have Stolen Data From Hundreds of Government Employees: Report – Crypto News
-

 Technology1 week ago
Last day of Amazon Sale 2025: Explore Unmissable deals on the best Apple iPads to boost your work and creativity – Crypto News
-
Business1 week ago
Will Cardano Price Hit $1 As Charles Hoskinson Fights $318M TGE Rumor? – Crypto News
-
Business1 week ago
US-UK Trade Deal: Is Trump’s ‘Major Trade Deal’ Powering Today’s Crypto Market Rally? – Crypto News