


others
Canadian Dollar goes sideways on Thursday after mixed US data print – Crypto News
- Canadian Dollar went in both directions on Thursday’s mixed US data.
- Canada is absent from economic calendar until Friday’s GDP update.
- US PCE Price Index inflation also looms ahead on Friday.
The Canadian Dollar (CAD) gave a mixed performance on Thursday after a data-light economic calendar on the Canadian side left the CAD to twist amid a mixed print in key US figures. Markets are gearing up for Friday’s US Personal Consumption Expenditure Price Index (PCE) inflation release after Thursday’s burgeoning US release schedule ran the gamut.
Canada is absent from the economic calendar on Thursday, leaving CAD traders to shuffle in place until Friday’s Canadian Gross Domestic Product (GDP) update for April.
However, Friday’s US PCE Price Index inflation is set to eclipse Canadian GDP figures entirely. As a key reading of inflation for the Federal Reserve (Fed), significant market attention will be focused squarely on US price growth figures to cap off the trading week.
Daily digest market movers: US data comes in mixed, Canadian Dollar follows suit
- US Durable Goods Orders contracted in May, clocking in -0.1% MoM versus the forecast 0.2%, falling further than expected from the previous 0.4%.
- US Q1 GDP came in exactly as expected with first-quarter GDP slightly revised to 1.4% from the initial print of 1.3%.
- US Initial Jobless Claims beat expectations with 233K net new jobless benefits seekers for the week ended June 21. Median market forecasts had expected a print of 236K compared to the previous week’s 238K.
- US Core Personal Consumption Expenditures, a preview of Friday’s PCE Price Index, ticked upwards to 3.7% in the first quarter versus the expected hold at 3.6%.
- Friday’s Canadian MoM GDP in May is expected to rebound to 0.3% from the previous flat print.
- US core PCE Price Index inflation is expected to ease to 0.1% in May from the previous 0.2%.
Canadian Dollar PRICE Today
The table below shows the percentage change of Canadian Dollar (CAD) against listed major currencies today. Canadian Dollar was the strongest against the Swiss Franc.
| USD | EUR | GBP | JPY | CAD | AUD | NZD | CHF | |
|---|---|---|---|---|---|---|---|---|
| USD | -0.24% | -0.22% | -0.06% | -0.11% | -0.02% | -0.12% | 0.07% | |
| EUR | 0.24% | 0.00% | 0.15% | 0.11% | 0.23% | 0.09% | 0.31% | |
| GBP | 0.22% | -0.00% | 0.18% | 0.11% | 0.23% | 0.12% | 0.32% | |
| JPY | 0.06% | -0.15% | -0.18% | -0.05% | 0.04% | -0.09% | 0.15% | |
| CAD | 0.11% | -0.11% | -0.11% | 0.05% | 0.08% | -0.01% | 0.19% | |
| AUD | 0.02% | -0.23% | -0.23% | -0.04% | -0.08% | -0.10% | 0.08% | |
| NZD | 0.12% | -0.09% | -0.12% | 0.09% | 0.01% | 0.10% | 0.20% | |
| CHF | -0.07% | -0.31% | -0.32% | -0.15% | -0.19% | -0.08% | -0.20% |
The heat map shows percentage changes of major currencies against each other. The base currency is picked from the left column, while the quote currency is picked from the top row. For example, if you pick the Canadian Dollar from the left column and move along the horizontal line to the US Dollar, the percentage change displayed in the box will represent CAD (base)/USD (quote).
Technical analysis: Canadian Dollar churns on data-light Thursday, but gains remain thin
The Canadian Dollar (CAD) is mixed on Thursday, giving a middling performance in overall quiet markets. The CAD is up over a tenth of a percent against the Swiss Franc (CHF) and the Japanese Yen (JPY), but falling back a fifth of a percent against the Euro (EUR) and the Pound Sterling (GBP).
USD/CAD is stuck close to Thursday’s opening bids after an early dip to 1.3680. The pair remains stuck in a price action trap near the 1.3700 handle as intraday bids get hung up on the 200-hour Exponential Moving Average (EMA) at 1.3692.
Daily candlesticks are forming a bullish bounce after running aground of the 50-day EMA at 1.3676 and is set to snap a near-term losing streak after the pair flubbed a bullish recovery of the 1.3800 handle earlier in June.
USD/CAD hourly chart
USD/CAD daily chart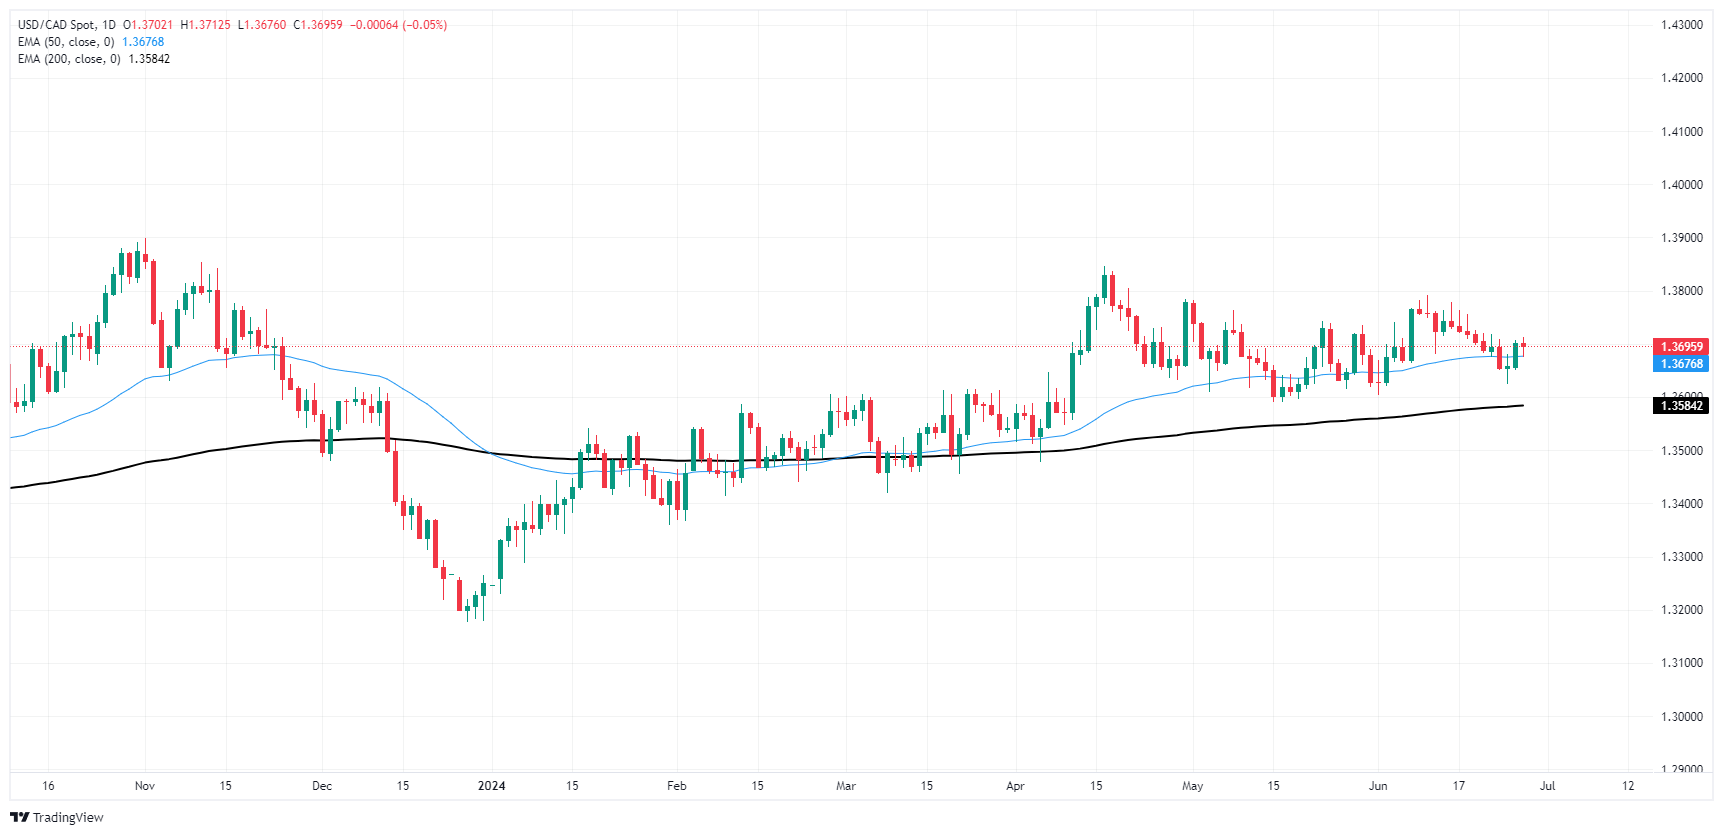
Economic Indicator
Core Personal Consumption Expenditures – Price Index (MoM)
The Core Personal Consumption Expenditures (PCE), released by the US Bureau of Economic Analysis on a monthly basis, measures the changes in the prices of goods and services purchased by consumers in the United States (US). The PCE Price Index is also the Federal Reserve’s (Fed) preferred gauge of inflation. The MoM figure compares the prices of goods in the reference month to the previous month.The core reading excludes the so-called more volatile food and energy components to give a more accurate measurement of price pressures. Generally, a high reading is bullish for the US Dollar (USD), while a low reading is bearish.


-
others1 week ago
Will Ethereum Price Rally to $3,200 as Wall Street Pivots from BTC to ETH – Crypto News
-
![DIS Elliott Wave technical analysis [Video]](https://dripp.zone/news/wp-content/uploads/2025/06/DIS-Elliott-Wave-technical-analysis-Video-Crypto-News-400x240.jpg)
![DIS Elliott Wave technical analysis [Video]](https://dripp.zone/news/wp-content/uploads/2025/06/DIS-Elliott-Wave-technical-analysis-Video-Crypto-News-80x80.jpg) others1 week ago
others1 week agoSkies are clearing for Delta as stock soars 13% on earnings beat – Crypto News
-
others1 week ago
Skies are clearing for Delta as stock soars 13% on earnings beat – Crypto News
-

 Blockchain1 week ago
Insomnia Labs Debuts Stablecoin Credit Platform for Creators – Crypto News
-

 Blockchain1 week ago
Ant Group Eyes USDC Integration Circle’s: Report – Crypto News
-

 Cryptocurrency5 days ago
Whale Sells $407K TRUMP, Loses $1.37M in Exit – Crypto News
-

 Cryptocurrency1 week ago
Tornado Cash Judge Won’t Let One Case Be Mentioned in Roman Storm’s Trial: Here’s Why – Crypto News
-

 Blockchain1 week ago
XRP Rally Possible If Senate Web3 Crypto Summit Goes Well – Crypto News
-

 others1 week ago
USD/CAD trades with positive bias below 1.3700; looks to FOMC minutes for fresh impetus – Crypto News
-

 Blockchain1 week ago
Kraken and Backed Expand Tokenized Equities to BNB Chain – Crypto News
-

 others1 week ago
EUR/GBP posts modest gain above 0.8600 ahead of German inflation data – Crypto News
-

 Cryptocurrency1 week ago
Bitcoin Breaks New Record at $111K, What’s Fueling the $120K Price Target? – Crypto News
-
Technology1 week ago
XRP Eyes $3 Breakout Amid Rising BlackRock ETF Speculation – Crypto News
-
Business1 week ago
PENGU Rallies Over 20% Amid Coinbase’s Pudgy Penguins PFP Frenzy – Crypto News
-

 Blockchain5 days ago
Robinhood Dealing With Fallout of Tokenized Equities Offering – Crypto News
-
 Cryptocurrency1 week ago
Is ETH Finally Ready to Shoot For $3K? (Ethereum Price Analysis) – Crypto News
-

 Blockchain1 week ago
Binance Founder Backs BNB Treasury Company Aiming For US IPO – Crypto News
-

 Blockchain1 week ago
Ethereum Bulls Roar — $3K Beckons After 5% Spike – Crypto News
-

 Blockchain1 week ago
Australia Banks Join Digital Currency Trial for Tokenized Assets – Crypto News
-
Business1 week ago
Did Ripple Really Win XRP Lawsuit Despite $125M Fine? Lawyer Fires Back at CEO – Crypto News
-

 Cryptocurrency1 week ago
XRP price forecast as coins surges 2.19% to $2.33 – Crypto News
-

 Metaverse1 week ago
How Brands Can Deepen Customer Connections in the Metaverse – Crypto News
-

 Technology1 week ago
Perplexity launches Comet, an AI-powered browser to challenge Google Chrome; OpenAI expected to enter the space soon – Crypto News
-

 Blockchain1 week ago
SUI Chart Pattern Confirmation Sets $3.89 Price Target – Crypto News
-
Technology1 week ago
Breaking: SharpLink Purchases 10,000 ETH from Ethereum Foundation, SBET Stock Up 7% – Crypto News
-

 others1 week ago
EUR/GBP climbs as weak UK data fuels BoE rate cut speculation – Crypto News
-

 Blockchain1 week ago
Bitcoin Hits All-Time High as Crypto Legislation Votes Near – Crypto News
-
Technology1 week ago
GameSquare Stock Shoots 58% After Revealing $100 Million Ethereum Treasury Strategy – Crypto News
-

 others1 week ago
Australian Dollar remains stronger due to persistent inflation risks, FOMC Minutes eyed – Crypto News
-

 others1 week ago
US Dollar Resurgence May Be Around the Corner, According to Barclays Currency Strategist – Here’s Why: Report – Crypto News
-
others1 week ago
Trump Jr. Backed Thumzup Media To Invest In ETH, XRP, SOL, DOGE And LTC – Crypto News
-

 Technology1 week ago
Google’s worst nightmare? OpenAI’s new AI web browser is coming soon to challenge Chrome – Crypto News
-

 Cryptocurrency1 week ago
Bitcoin Hits Record Peak. How High Can It Surge in 2025? – Crypto News
-
Technology1 week ago
VC Firm Ego Death Capital Closes $100M Funding to Back Bitcoin-Based Projects – Crypto News
-
Cryptocurrency1 week ago
Tokenized Securities Are Still Securities, US SEC Warns Robinhood, Kraken – Crypto News
-

 others1 week ago
NovaEx Launches with a Security-First Crypto Trading Platform Offering Deep Liquidity and Institutional-Grade Infrastructure – Crypto News
-

 others1 week ago
Anthony Scaramucci Says $180,000 Bitcoin Price Explosion Possible As BTC ‘Supremacy’ Creeps Up – Here’s His Timeline – Crypto News
-
Cryptocurrency1 week ago
Bitcoin Breaks New Record at $111K, What’s Fueling the $120K Price Target? – Crypto News
-
Business1 week ago
US Senate To Release CLARITY Act Draft Next Week – Crypto News
-

 others1 week ago
$687,220,000 in Bitcoin Shorts Liquidated in Just One Hour As BTC Explodes To $116,000 – Crypto News
-

 Business1 week ago
S&P Global Downgrades Saks Global’s Credit Rating – Crypto News
-

 Cryptocurrency4 days ago
Satoshi-Era Bitcoin Whale Moves Another $2.42 Billion, What’s Happening? – Crypto News
-

 Technology1 week ago
10 Smartchoice tablets from top brands, curated for everyday use, up to 45% off before Amazon Prime Day Sale – Crypto News
-
others1 week ago
China’s Ant Group With 1.4B Users Taps Circle to Integrate USDC – Crypto News
-

 Blockchain6 days ago
Ziglu Faces $2.7M Shortfall as Crypto Fintech Enters Special Administration – Crypto News
-

 Cryptocurrency1 week ago
Ethereum ascends: Institutional pivot and dormant whale moves signal a new era – Crypto News
-
Business1 week ago
XRP Open Interest Skyrockets Ahead Of ProShares XRP ETF Approval – Crypto News
-

 Blockchain1 week ago
Analyst Predicts 50% “Moonshot” For XRP Price If This Line Breaks – Crypto News
-
others1 week ago
Donald Trump Pushes For A 300 Basis Points Fed Rate Cut – Crypto News
-
Technology1 week ago
Breaking: Bitcoin Price Hits New ATH Amid Trump Tariff Scare – Crypto News