


others
Canadian Dollar looking to lock in gains for the week in back-and-forth trading – Crypto News
- The CAD caught a bounce on risk appetite in early Friday trading.
- Industrial inflation figures in Canada print better than expected.
- US Dollar, Fed reaction is driving the market today.
The Canadian Dollar (CAD) is looking to pare back some of Thursday’s losses, catching some support from bolstered Crude Oil bids, but downside risks remain.
The Loonie is up about half a percent against the US Dollar (USD) for the week.
Canadian industrial inflation figures went head-to-head with US housing data Friday morning, but overall, risk sentiment appears to be the primary driver of moment-to-moment market moves.
Daily Digest Market Movers: Canadian Dollar unable to develop long legs to round out the week
- Canada’s Raw Material Price Index for October showed a 2.5% decline after September’s 3.9% jump (revised from 3.5%).
- Month-on-month Industrial Product Prices into October similarly declined 1%, contracting from the previous 0.4%.
- US Building Permits and US Housing starts both beat expectations, helping to arrest the Greenback’s early Friday slide and capping off CAD gains.
- US economy showed 1.487 million new building permits, beating the forecast of 1.45 million and clearing the previous month’s 1.471 million.
- US monthly Housing Starts also showed improvement, printing at 1.372 million versus the forecast for 1.35 million. September saw ground broken on 1.346 million new residential buildings.
- Crude Oil is seeing some lift on Friday, bolstered by rumors of additional EU sanctions on Russian Crude Oil exports.
- A back-and-forth trading week leaves the CAD strung along Friday’s mid-range.
- The overall trading week was also middling for the Loonie as the USD drove broad-market momentum.
Technical Analysis: Canadian Dollar strung along the middle for Friday as markets second-guess direction
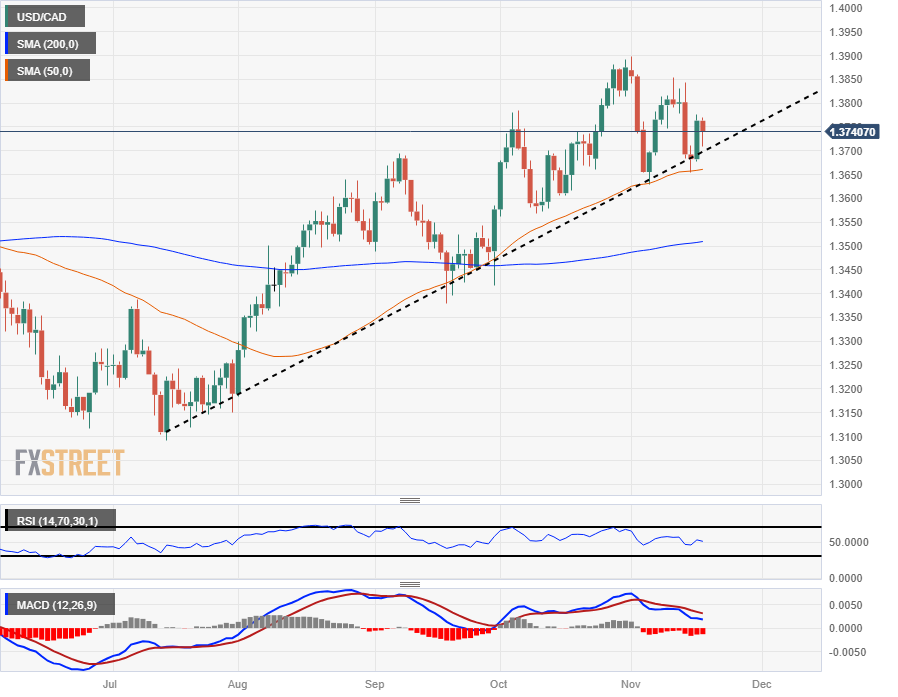
The Canadian Dollar (CAD) is testing chart territory below 1.3750 against the US Dollar (USD), but the day’s Loonie bids are coming under threat as USD/CAD bidders make a feeble push.
The USD/CAD hit a daily low of 1.3708 before seeing a thin rebound toward 1.3740.
The pair hit a mid-week high near 1.3780 on Thursday, and CAD bidders have been struggling to pare away the bounce from the mid-week low near 1.3660.
Daily candlesticks have the USD/CAD consolidating in rough trading just above the 50-day Simple Moving Average (SMA), and technical indicators are beginning to grind toward the middle.
USD/CAD Hourly Chart
USD/CAD Daily Chart
Canadian Dollar price this week
The table below shows the percentage change of Canadian Dollar (CAD) against listed major currencies this week. Canadian Dollar was the strongest against the US Dollar.
| USD | EUR | GBP | CAD | AUD | JPY | NZD | CHF | |
| USD | -1.78% | -1.64% | -0.42% | -2.03% | -1.13% | -1.29% | -1.72% | |
| EUR | 1.75% | 0.13% | 1.32% | -0.24% | 0.64% | 0.48% | 0.06% | |
| GBP | 1.61% | -0.14% | 1.19% | -0.38% | 0.49% | 0.35% | -0.08% | |
| CAD | 0.42% | -1.35% | -1.21% | -1.59% | -0.71% | -0.86% | -1.29% | |
| AUD | 1.98% | 0.24% | 0.37% | 1.56% | 0.87% | 0.72% | 0.29% | |
| JPY | 1.11% | -0.63% | -0.48% | 0.69% | -0.90% | -0.12% | -0.58% | |
| NZD | 1.27% | -0.49% | -0.36% | 0.83% | -0.73% | 0.14% | -0.43% | |
| CHF | 1.68% | -0.07% | 0.07% | 1.26% | -0.32% | 0.56% | 0.41% |
The heat map shows percentage changes of major currencies against each other. The base currency is picked from the left column, while the quote currency is picked from the top row. For example, if you pick the Euro from the left column and move along the horizontal line to the Japanese Yen, the percentage change displayed in the box will represent EUR (base)/JPY (quote).
Inflation FAQs
Inflation measures the rise in the price of a representative basket of goods and services. Headline inflation is usually expressed as a percentage change on a month-on-month (MoM) and year-on-year (YoY) basis. Core inflation excludes more volatile elements such as food and fuel which can fluctuate because of geopolitical and seasonal factors. Core inflation is the figure economists focus on and is the level targeted by central banks, which are mandated to keep inflation at a manageable level, usually around 2%.
The Consumer Price Index (CPI) measures the change in prices of a basket of goods and services over a period of time. It is usually expressed as a percentage change on a month-on-month (MoM) and year-on-year (YoY) basis. Core CPI is the figure targeted by central banks as it excludes volatile food and fuel inputs. When Core CPI rises above 2% it usually results in higher interest rates and vice versa when it falls below 2%. Since higher interest rates are positive for a currency, higher inflation usually results in a stronger currency. The opposite is true when inflation falls.
Although it may seem counter-intuitive, high inflation in a country pushes up the value of its currency and vice versa for lower inflation. This is because the central bank will normally raise interest rates to combat the higher inflation, which attract more global capital inflows from investors looking for a lucrative place to park their money.
Formerly, Gold was the asset investors turned to in times of high inflation because it preserved its value, and whilst investors will often still buy Gold for its safe-haven properties in times of extreme market turmoil, this is not the case most of the time. This is because when inflation is high, central banks will put up interest rates to combat it.
Higher interest rates are negative for Gold because they increase the opportunity-cost of holding Gold vis-a-vis an interest-bearing asset or placing the money in a cash deposit account. On the flipside, lower inflation tends to be positive for Gold as it brings interest rates down, making the bright metal a more viable investment alternative.


-
![DIS Elliott Wave technical analysis [Video]](https://dripp.zone/news/wp-content/uploads/2025/06/DIS-Elliott-Wave-technical-analysis-Video-Crypto-News-400x240.jpg)
![DIS Elliott Wave technical analysis [Video]](https://dripp.zone/news/wp-content/uploads/2025/06/DIS-Elliott-Wave-technical-analysis-Video-Crypto-News-80x80.jpg) others1 week ago
others1 week agoSkies are clearing for Delta as stock soars 13% on earnings beat – Crypto News
-
others1 week ago
Skies are clearing for Delta as stock soars 13% on earnings beat – Crypto News
-

 Cryptocurrency6 days ago
Whale Sells $407K TRUMP, Loses $1.37M in Exit – Crypto News
-
Technology1 week ago
XRP Eyes $3 Breakout Amid Rising BlackRock ETF Speculation – Crypto News
-
Technology1 week ago
Breaking: SharpLink Purchases 10,000 ETH from Ethereum Foundation, SBET Stock Up 7% – Crypto News
-

 Blockchain1 week ago
Bitcoin Hits All-Time High as Crypto Legislation Votes Near – Crypto News
-
Business1 week ago
PENGU Rallies Over 20% Amid Coinbase’s Pudgy Penguins PFP Frenzy – Crypto News
-

 Blockchain7 days ago
Robinhood Dealing With Fallout of Tokenized Equities Offering – Crypto News
-

 Cryptocurrency6 days ago
Satoshi-Era Bitcoin Whale Moves Another $2.42 Billion, What’s Happening? – Crypto News
-

 Metaverse1 week ago
How Brands Can Deepen Customer Connections in the Metaverse – Crypto News
-

 Technology1 week ago
Perplexity launches Comet, an AI-powered browser to challenge Google Chrome; OpenAI expected to enter the space soon – Crypto News
-
 Cryptocurrency1 week ago
Bitcoin Breaks New Record at $111K, What’s Fueling the $120K Price Target? – Crypto News
-

 others1 week ago
EUR/GBP climbs as weak UK data fuels BoE rate cut speculation – Crypto News
-

 Blockchain1 week ago
SUI Chart Pattern Confirmation Sets $3.89 Price Target – Crypto News
-
Business1 week ago
US Senate To Release CLARITY Act Draft Next Week – Crypto News
-

 others1 week ago
$687,220,000 in Bitcoin Shorts Liquidated in Just One Hour As BTC Explodes To $116,000 – Crypto News
-

 Business1 week ago
S&P Global Downgrades Saks Global’s Credit Rating – Crypto News
-

 others1 week ago
Anthony Scaramucci Says $180,000 Bitcoin Price Explosion Possible As BTC ‘Supremacy’ Creeps Up – Here’s His Timeline – Crypto News
-
Cryptocurrency1 week ago
Bitcoin Breaks New Record at $111K, What’s Fueling the $120K Price Target? – Crypto News
-
Business1 week ago
XRP Set for Big Week as ProShares ETF Launches July 18 – Crypto News
-
Technology4 days ago
Fed Rate Cut Odds Surge As Powell’s Future Hangs In The Balance – Crypto News
-
Business1 week ago
Breaking: US SEC Delays Grayscale Avalanche ETF Launch – Crypto News
-

 De-fi1 week ago
Ousted Movement Labs Co-Founder Sues Startup in Delaware Court – Crypto News
-
Technology4 days ago
Fed Rate Cut Odds Surge As Powell’s Future Hangs In The Balance – Crypto News
-

 Technology1 week ago
One Tech Tip: Click-to-cancel is over, but there are other ways to unsubscribe – Crypto News
-

 Technology1 week ago
Google DeepMind hires Windsurf CEO as OpenAI’s $3 billion acquisition collapses – Crypto News
-
Technology1 week ago
Hyperliquid Hits Record $10.6B OI As HYPE Price Records New ATH – Crypto News
-

 Blockchain1 week ago
Ziglu Faces $2.7M Shortfall as Crypto Fintech Enters Special Administration – Crypto News
-
Cryptocurrency7 days ago
Why Is Bitcoin Up Today? – Crypto News
-

 Cryptocurrency6 days ago
Strategy Resumes Bitcoin Buys, Boosting Holdings to Over $72 Billion in BTC – Crypto News
-

 Cryptocurrency6 days ago
Bitcoin Breaches $120K, Institutional FOMO Takes and House Debate Propel Gains – Crypto News
-

 Blockchain4 days ago
Ripple and Ctrl Alt Team to Support Real Estate Tokenization – Crypto News
-
Business4 days ago
XRP Lawsuit Update: Ripple Paid $125M in Cash, Settlement Hinges on Appeal – Crypto News
-

 Blockchain1 week ago
Coinbase Partners With Perplexity AI to Integrate Market Data – Crypto News
-

 Technology1 week ago
Outlook outage: Microsoft responds, but frustrated users clap back with hilarious memes – Crypto News
-
 Blockchain1 week ago
Bitcoin Breakout Not Just Hype—$4.4B Inflows Back The Move – Crypto News
-

 Technology1 week ago
Nvidia now briefly hits $4 trillion in trading, stocks and bitcoin rally – Crypto News
-
Technology1 week ago
ETH Is Next BTC? BlackRock Is Ditching Bitcoin And Buying More Ethereum – Crypto News
-

 others1 week ago
Gold struggles to capitalize on its modest intraday gains amid mixed cues – Crypto News
-

 Blockchain1 week ago
XRP Price Builds Momentum — $2.50 Break Sparks Fresh Bullish Wave – Crypto News
-
![Cardano [ADA] price prediction - 8% rally next, but here's why you should be careful!](https://dripp.zone/news/wp-content/uploads/2025/07/Cardano-ADA-price-prediction-8-rally-next-but-heres.webp-400x240.webp)
![Cardano [ADA] price prediction - 8% rally next, but here's why you should be careful!](https://dripp.zone/news/wp-content/uploads/2025/07/Cardano-ADA-price-prediction-8-rally-next-but-heres.webp-80x80.webp) Cryptocurrency1 week ago
Cryptocurrency1 week agoCardano [ADA] price prediction – 8% rally next, but here’s why you should be careful! – Crypto News
-

 others1 week ago
Bitcoin Primed for the Next Major Parabolic Advance, Says Crypto Analyst Kevin Svenson – Here Are His Targets – Crypto News
-

 others1 week ago
MultiBank Group Confirms MBG Token TGE Set for July 22, 2025 – Crypto News
-

 Cryptocurrency1 week ago
Why is ZK proof altcoin Lagrange (LA) dropping amid a rally in crypto market – Crypto News
-

 Blockchain1 week ago
SUI Explodes Higher, Climbing Above 20-Day MA — But Can The Rally Hold? – Crypto News
-

 Cryptocurrency1 week ago
XRP price targets breakout above $3 as BTC hits fresh ATH – Crypto News
-
Technology1 week ago
Breaking: Jerome Powell Allegedly Considering Resignation Amid Trump’s Criticism – Crypto News
-
Business1 week ago
XRP Price Prediction As Bitcoin Makes News All Time Highs- Is XRP Next? – Crypto News
-

 others1 week ago
Top US-Based Crypto Exchange by Trading Volume Coinbase Adds Support for DeFi Tokens SKY and USDS – Crypto News
-

 Cryptocurrency1 week ago
House Democrats Struggle to Approach ‘Crypto Week’ With Unified Front – Crypto News