


others
DJIA moves higher, but weekly streak set to end – Crypto News
- Dow Jones Industrial Index gained 11.8% over the previous five weeks but sold off from Monday through Wednesday of this week.
- US Jobless Claims arrived slightly below consensus on Wednesday.
- US Treasury yields are falling in the front half of the curve but rising in the back half.
- US Nonfarm Payrolls, Unemployment Rate and Average Hourly Earnings data will hold sway over US markets on Friday.
- DJIA is now in spitting distance of all-time high at 36,952 from January 2022.
The Dow Jones Industrial Average (DJIA) looks like it might end its five-week streak of gains this week as the index drifted lower during the first three sessions this week. The DJIA has gained 0.2% on Thursday but not enough for confidence.
The S&P 500 and NASDAQ Composite, on the other hand, have risen 0.8% and 1.3%, respectively, at the time of writing. The stock market is benefiting from US Jobless Claims data that showed fewer job losses than expected. Additionally, US Treasury yields are largely trading lower, an event that typically helps stock prices.
The market is primarily focused on November Nonfarm Payrolls data that will be released on Friday, alongside Unemployment Rate and Average Hourly Earnings reports for the same month.
Dow Jones News: US Initial Jobless Claims tick higher but below forecast
US Initial Jobless Claims for the week ending December 1 were reported on Thursday morning at 220K. This was slightly higher than the 219K reported the previous week but below the 220K forecast.
Continuing Jobless Claims dropped precipitously from the previous report of 1.925 million to 1.861 million as well. This figure was noticeably lower than the 1.91 million consensus.
Taken together, these reports show a labor market holding up in spite of the Federal Reserve (Fed) strategy of holding interest rates “higher for longer”. Additionally, the data is more fodder for the market’s popular narrative of a “soft landing”.
For the most part, inflation readings have been trending lower all year, but the central bank’s higher interest rate environment has not translated into major job losses as some had expected. Lower inflation alongside a relatively healthy labor market is a recipe for an optimistic stock market, and that is why equities are trending higher on Thursday.
Contrasting with the first two reports was the Challenger Job Cuts report, which also was released Thursday morning. It showed corporate layoffs in November jumping from the 36.8K reported previously to 45.5K.
Nonfarm Payrolls, Unemployment Rate, Michigan Consumer Sentiment make market data-dependent on Friday
Friday is gearing up to be a heavy session that should see plenty of volatility based on the release of a slew of economic indicators.
First up and most important is the November Nonfarm Payrolls report. Consensus calls for 180K new hires in November, up from 150K in October. Anything below 200K will likely excite equity traders, while a figure above 200K will worry many. Weaker but not too weak NFPs are fawned over by the market at this time as evidence that demonstrates to the Fed that it’s okay to pull the proverbial foot off the gas pedal.
The Unemployment Rate in November is expected to sit still at 3.9%. A lower reading might also worry the market as a tight labor market stands to push up wage inflation. On that note, Average Hourly Earnings for November are expected to grow by 0.3% from October and 4% from a year earlier. This compares to October data showing 0.2% MoM growth and 4.1% annually.
In addition, the preliminary Michigan Consumer Sentiment Index for December will see the light of day on Friday. The index is expected to show a rise from 61.3 to 62 as the holiday season acts to reinvigorate optimism.
S&P 500 FAQs
The S&P 500 is a widely followed stock price index which measures the performance of 500 publicly owned companies, and is seen as a broad measure of the US stock market. Each company’s influence on the computation of the index is weighted based on market capitalization. This is calculated by multiplying the number of publicly traded shares of the company by the share price. The S&P 500 index has achieved impressive returns – $1.00 invested in 1970 would have yielded a return of almost $192.00 in 2022. The average annual return since its inception in 1957 has been 11.9%.
Companies are selected by committee, unlike some other indexes where they are included based on set rules. Still, they must meet certain eligibility criteria, the most important of which is market capitalization, which must be greater than or equal to $12.7 billion. Other criteria include liquidity, domicile, public float, sector, financial viability, length of time publicly traded, and representation of the industries in the economy of the United States. The nine largest companies in the index account for 27.8% of the market capitalization of the index.
There are a number of ways to trade the S&P 500. Most retail brokers and spread betting platforms allow traders to use Contracts for Difference (CFD) to place bets on the direction of the price. In addition, that can buy into Index, Mutual and Exchange Traded Funds (ETF) that track the price of the S&P 500. The most liquid of the ETFs is State Street Corporation’s SPY. The Chicago Mercantile Exchange (CME) offers futures contracts in the index and the Chicago Board of Options (CMOE) offers options as well as ETFs, inverse ETFs and leveraged ETFs.
Many different factors drive the S&P 500 but mainly it is the aggregate performance of the component companies revealed in their quarterly and annual company earnings reports. US and global macroeconomic data also contributes as it impacts on investor sentiment, which if positive drives gains. The level of interest rates, set by the Federal Reserve (Fed), also influences the S&P 500 as it affects the cost of credit, on which many corporations are heavily reliant. Therefore, inflation can be a major driver as well as other metrics which impact the Fed decisions.
Dow Jones Industrial Average forecast: DJIA should finally take a breather this week
The Dow Jones index is consolidating this week after a brisk 11.8% advance over the previous five weeks. This was one of the quickest index corrections in decades, and traders should not be surprised if investors decide to take profits now.
A pullback to the August 1 range high at 35,679 should not worry bulls, but a break below it may do so. The 4-week Simple Moving Average (SMA) is moving nearly in line with that resistance point, so it would be unsurprising if the index uses it for support this time around.
Much of the market probably wants to hold onto its gains however. This is because common wisdom says that it’s unwise to sell as you near all-time highs. 36,952, the all-time high from the first days of trading in January 2022, beckons bulls to hold on.
The best bet for bulls is to furnish a price target of 37,750 and stick to it. This is the 161.8% Fibonacci level (not pictured) based on the October low. While the daily chart has been showing oversold readings lately, the weekly chart’s Relative Strength Index (RSI) still sits in the low 60s and should probably allow for more upside in this rally.
Dow Jones Industrial Average weekly chart


-

 Cryptocurrency1 week ago
Whale Sells $407K TRUMP, Loses $1.37M in Exit – Crypto News
-

 Blockchain1 week ago
Robinhood Dealing With Fallout of Tokenized Equities Offering – Crypto News
-

 Cryptocurrency1 week ago
Satoshi-Era Bitcoin Whale Moves Another $2.42 Billion, What’s Happening? – Crypto News
-
Technology6 days ago
Fed Rate Cut Odds Surge As Powell’s Future Hangs In The Balance – Crypto News
-

 Cryptocurrency1 week ago
Strategy Resumes Bitcoin Buys, Boosting Holdings to Over $72 Billion in BTC – Crypto News
-

 Cryptocurrency1 week ago
Bitcoin Breaches $120K, Institutional FOMO Takes and House Debate Propel Gains – Crypto News
-

 Blockchain6 days ago
Ripple and Ctrl Alt Team to Support Real Estate Tokenization – Crypto News
-
Technology6 days ago
Fed Rate Cut Odds Surge As Powell’s Future Hangs In The Balance – Crypto News
-
Cryptocurrency1 week ago
Why Is Bitcoin Up Today? – Crypto News
-

 others6 days ago
EUR/USD recovers with trade talks and Fed independence in focus – Crypto News
-
Business5 days ago
XRP Lawsuit Update: Ripple Paid $125M in Cash, Settlement Hinges on Appeal – Crypto News
-
Business4 days ago
XLM Is More Bullish Than ETH, SOL, And XRP, Peter Brandt Declares – Crypto News
-
Technology1 week ago
Hyperliquid Hits Record $10.6B OI As HYPE Price Records New ATH – Crypto News
-

 Blockchain1 week ago
Ziglu Faces $2.7M Shortfall as Crypto Fintech Enters Special Administration – Crypto News
-

 Cryptocurrency1 week ago
Cardano’s $1.22 target: Why traders should be aware of THIS ADA setup – Crypto News
-
Business7 days ago
Pepe Coin Rich List June 2025: Who’s Holding Highest PEPE as it Nears Half a Million Holders? – Crypto News
-

 Metaverse6 days ago
Why voice is emerging as India’s next frontier for AI interaction – Crypto News
-

 Metaverse6 days ago
Nvidia’s Jensen Huang says AI ‘fundamental like electricity’, praises Chinese models as ‘catalyst for global progress’ – Crypto News
-

 Cryptocurrency5 days ago
Bitcoin trades near $119K after new all-time high; Coinbase rebrands wallet to ‘Base App’ – Crypto News
-
Cryptocurrency1 week ago
XRP, Solana and ADA Rally, Is Altcoin Season Back This July 2025? – Crypto News
-

 Technology1 week ago
Google, Anthropic, OpenAI and xAI join US defence to tackle national security with AI – Crypto News
-
![Stellar [XLM] bulls exhausted after rally - Is a pullback nearby?](https://dripp.zone/news/wp-content/uploads/2025/07/Stellar-XLM-bulls-exhausted-after-rally-Is-a-pullback.webp-400x240.webp)
![Stellar [XLM] bulls exhausted after rally - Is a pullback nearby?](https://dripp.zone/news/wp-content/uploads/2025/07/Stellar-XLM-bulls-exhausted-after-rally-Is-a-pullback.webp-80x80.webp) Cryptocurrency1 week ago
Cryptocurrency1 week agoStellar [XLM] bulls exhausted after rally – Is a pullback nearby? – Crypto News
-

 Cryptocurrency7 days ago
It’s a Statement, Says Bitfinex Alpha – Crypto News
-

 Cryptocurrency6 days ago
1inch price forecast: 1INCH hits 7-month high after double digit gains – Crypto News
-
Cryptocurrency6 days ago
1inch price forecast: 1INCH hits 7-month high after double digit gains – Crypto News
-
Business6 days ago
Ethereum Price Prediction- Bulls Target $3,700 As ETH Treasury Accumulation Soars – Crypto News
-

 others5 days ago
Top Crypto Exchange by Trading Volume Binance Announces Airdrop for New Ethereum (ETH) Ecosystem Altcoin – Crypto News
-
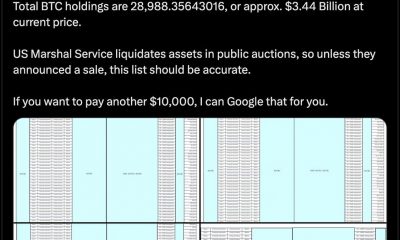
 De-fi5 days ago
U.S. Marshals Peg Federal Bitcoin Holdings at 28,988 Tokens Worth $3.4 B – Crypto News
-

 others5 days ago
GBP/USD rallies on US PPI dip and Trump’s potential Powell removal – Crypto News
-
others5 days ago
GBP/USD rallies on US PPI dip and Trump’s potential Powell removal – Crypto News
-
Cryptocurrency5 days ago
Russia’s $85 Billion Sberbank to Launch Crypto Custody Services – Crypto News
-

 Blockchain5 days ago
Nasdaq Exchange Files SEC Form to List Staking Ethereum ETF – Crypto News
-
Business1 week ago
Next Week To Make US The “Crypto Capital”, Says Bo Hines – Crypto News
-

 Cryptocurrency1 week ago
Bitcoin and Ethereum ETFs record $3.6B inflows this week – Crypto News
-
Technology1 week ago
Peter Schiff Reignites Bitcoin Criticism, Calls 21M Supply Arbitrary – Crypto News
-

 Technology1 week ago
Amazon Prime Day Sale 2025: Best earphones and headphone deals with up to 70% off – Crypto News
-

 others1 week ago
JPMorgan Chase CEO Says Traders May Be Seriously Mistaken on Fed Rate Cuts: Report – Crypto News
-

 Cryptocurrency1 week ago
Friday charts: The rise of zero-sum thinking – Crypto News
-

 others1 week ago
Crypto Hacker Who Drained $42,000,000 From GMX Goes White Hat, Returns Funds in Exchange for $5,000,000 Bounty – Crypto News
-

 Cryptocurrency1 week ago
Pump.fun Concludes $500M ICO in 12 Minutes — But Something Doesn’t Add Up – Crypto News
-

 Cryptocurrency1 week ago
Why Are So Many Crypto Games Shutting Down? Experts Weigh In – Crypto News
-
 De-fi1 week ago
Robinhood Opens Ether and Solana Staking to US Users – Crypto News
-

 Blockchain1 week ago
UK Banks Should not Issue Stablecoins – Crypto News
-

 Cryptocurrency1 week ago
Donald Trump Jr. backs social media startup aiming to become a crypto powerhouse – Crypto News
-

 Cryptocurrency1 week ago
Top 3 altcoins under $1 worth watching: Sei, Ethena, Arbitrum – Crypto News
-
 Blockchain1 week ago
The Bitcoin Liquidity Supercycle Has Just Begun: Hedge Fund CEO – Crypto News
-
Business1 week ago
CME XRP Futures Hit $1.6B In Total Trading Volume Since Launch – Crypto News
-
others1 week ago
Bitcoin Critic Vanguard Becomes Strategy’s (MSTR) Largest Shareholder – Crypto News
-

 Technology1 week ago
V Guard INSIGHT-G BLDC fan review: Cool performer with a premium look – Crypto News
-
Cryptocurrency1 week ago
Fed’s Hammack Raises Inflation Concerns Amid Push For Interest Rate Cut – Crypto News