


others
EUR/GBP clears daily losses, still poised for a weekly loss – Crypto News
- The EUR/GBP traded in the range of 0.8554-0.8521 and is set to close a 0.50% weekly loss on Friday.
- Lower British yields weakened the made it difficult for the Sterling to find demand.
- Eyes on German Inflation and British labor market data next week.
On Friday, the EUR/GBP traded with losses falling to a low of 0.8521 and then settling around 0.8545. The Eurozone’s and British calendars had nothing relevant to offer, and the focus is next week’s Consumer Price Index (CPI) data from Germany and labor market data from the UK.
During the session, the GBP weakened on failing British yields. The 2-year yield, after jumping on Thursday to multi-year highs, declined by more than 2% to 5.37%, while the 5 and 10-year rates also decreased, to 4.84% and 4.65%, respectively.
The British bond market may see volatility next Tuesday when crucial labor market data will be released. The Claimant Count Change and the Average Earnings data are closely monitored by the Bank of England when deciding its monetary policy. As for now, markets are largely discounting a 50 basis point (bps) for the August 3 meeting, followed by another 0.5% hike in September 21.
On the other hand, investors are pricing a 25 basis points (bps) hike in the next European Central Bank (ECB) meeting in July, and another one in September is nearly 60% discounted. That said, CPI figures from Germany from next week will continue modeling the expectations regarding the ECB’s next steps.
EUR/GBP Levels to watch
According to the daily chart, despite Indicators turning flat, the EUR/GBP’s Outlook is still tilted to the downside. The Relative Strength Index (RSI) stands neutral in negative territory, while the Moving Average Convergence Divergence (MACD) prints lower green bars, indicating a fading upward momentum.
Support Levels: 0.8520, 0.8490, 0.8450.
Resistance Levels: 0.8560, 0.8571 (20-day Simple Moving Average), 0.8595.
EUR/GBP Daily chart


-

 Cryptocurrency4 days ago
SUI eyes 24% rally as bullish price action gains strength – Crypto News
-

 Cryptocurrency3 days ago
Coinbase scores major win as SEC set to drop lawsuit – Crypto News
-

 Technology1 week ago
Lava Pro Watch X with 1.44-inch AMOLED display, in-built GPS launched in India at ₹4,499 – Crypto News
-

 others7 days ago
Japanese Yen remains depressed amid modest USD strength; downside seems limited – Crypto News
-

 Blockchain7 days ago
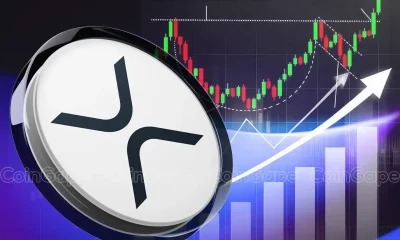
XRP Price Pulls Back From Highs—Are Bulls Still in Control? – Crypto News
-

 Technology1 week ago
Perplexity takes on ChatGPT and Gemini with new Deep Research AI that completes most tasks in under 3 minutes – Crypto News
-

 Blockchain1 week ago
XRP To 3 Digits? The ‘Signs’ That Could Confirm It, Basketball Analyst Says – Crypto News
-

 others1 week ago
Australian Dollar jumps to highs since December on USD weakness – Crypto News
-

 Cryptocurrency1 week ago
Who is Satoshi Nakamoto, The Creator of Bitcoin? – Crypto News
-

 Business1 week ago
Elon Musk’s DOGE Launches Probe into US SEC, Ripple Lawsuit To End? – Crypto News
-

 Business7 days ago
Whales Move From Shiba Inu to FXGuys – Here’s Why – Crypto News
-

 Technology4 days ago
Stellantis Debuts System to Handle ‘Routine Driving Tasks’ – Crypto News
-

 Cryptocurrency1 week ago
Crypto narratives as we await next market move – Crypto News
-
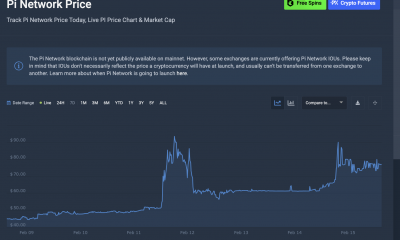
 Business1 week ago
How Will It Affect Pi Coin Price? – Crypto News
-

 Business1 week ago
What Will be KAITO Price At Launch? – Crypto News
-

 Blockchain1 week ago
XRP Set To Outshine Gold? Analyst Predicts 1,000% Surge – Crypto News
-

 Technology7 days ago
Luminious inverters for your home to never see darkness again – Crypto News
-

 Blockchain1 week ago
Is BTC Heading For $150K Rally? – Crypto News
-

 Technology1 week ago
Weekly Tech Recap: JioHotstar launched, Sam Altman vs Elon Musk feud intensifies, Perplexity takes on ChatGPT and more – Crypto News
-

 Technology1 week ago
Best gaming mobiles under ₹20,000 in February 2025: Poco X6 Pro, OnePlus Nord CE 4 Lite and more – Crypto News
-

 Cryptocurrency1 week ago
GameStop Stock Price Pumps After Report of Bitcoin Buying Plans – Crypto News
-

 Technology1 week ago
What will it take for India to become a global data centre hub? – Crypto News
-

 Technology1 week ago
ChatGPT vs Perplexity: Sam Altman praises Aravind Srinivas’ Deep Research AI; ‘Proud of you’ – Crypto News
-

 Blockchain1 week ago
NEAR Breaks Below Parallel Channel: Key Levels To Watch – Crypto News
-

 Blockchain1 week ago
Will BTC Rebound Or Drop To $76,000? – Crypto News
-

 Blockchain1 week ago
XRP Price Settles After Gains—Is a Fresh Upside Move Coming? – Crypto News
-
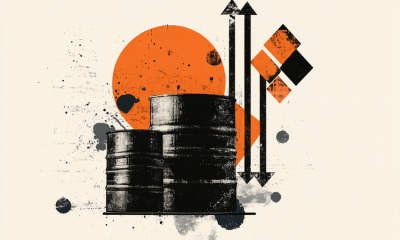
 others1 week ago
WTI price bullish, according to FXStreet data – Crypto News
-

 Metaverse1 week ago
How AI will divide the best from the rest – Crypto News
-

 Business1 week ago
These 3 Altcoins Will Help You Capitalize on Stellar’s Recent DIp – Crypto News
-
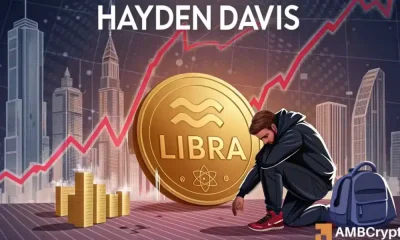
 Cryptocurrency7 days ago
Hayden Davis crypto scandal deepens as LIBRA memecoin faces fraud allegations – Crypto News
-

 Technology1 week ago
OpenAI board unanimously rejects Musk’s $97.4 billion takeover bid: ‘Not for sale’ – Crypto News
-

 Technology1 week ago
Grok 3 is coming! Elon Musk announces launch date, promises ‘smartest AI on Earth’ – Crypto News
-

 Technology1 week ago
Union Minister Ashwini Vaishnaw to launch India AI Mission portal soon, 10 companies set to provide 14,000 GPUs – Crypto News
-
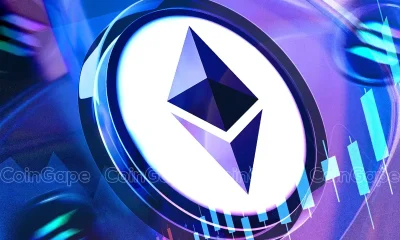
 Business1 week ago
Why Ethereum (ETH) Price Revival Could Start Soon After Solana Mess? – Crypto News
-
 Business1 week ago
Market Veteran Predicts XRP Price If Ripple Completes Cup and Handle Pattern – Crypto News
-

 others1 week ago
Forex Today: What if the RBA…? – Crypto News
-

 others1 week ago
US Dollar struggles to gather traction on quiet Monday – Crypto News
-
 Cryptocurrency6 days ago
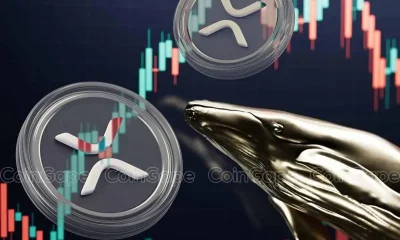
Ripple Whale Bags 20M Coins Amid Recent Dip, What’s Happening? – Crypto News
-
others1 week ago
Japan CFTC JPY NC Net Positions up to ¥54.6K from previous ¥18.8K – Crypto News
-

 Blockchain1 week ago
XRP Bullish Pennant Targets $15-$17 But Confirmation Is Required – Crypto News
-

 Technology1 week ago
South Korea removes DeepSeek from app stores, existing users advised to ‘service with caution’ – Crypto News
-

 Blockchain1 week ago
Bitcoin Price Falls Short Again—Is a Deeper Decline Coming? – Crypto News
-

 others1 week ago
Gas prices still remain elevated – ING – Crypto News
-

 Metaverse7 days ago
Grok 3 launch LIVE Updates: Elon Musk’s xAI to unveil ‘smartest AI on Earth’ today – Crypto News
-

 Cryptocurrency7 days ago
Bitcoin Sees $430M in Outflows as Market Responds to Fed’s Hawkish Stance – Crypto News
-

 Cryptocurrency7 days ago
Judge Assigned to Probe Argentina’s President Milei Over Alleged Crypto Scam – Crypto News
-

 Technology7 days ago
HYPE Price Shoots 10% As Hyperliquid EVM Goes Live – Crypto News
-

 Technology3 days ago
Why is BTC Down Today? – Crypto News
-
Technology3 days ago
Why is BTC Down Today? – Crypto News
-
Technology3 days ago
Why is BTC Down Today? – Crypto News