


others
EUR/USD sees thin rebound on quiet Wednesday after European GDP holds steady – Crypto News
- EUR/USD recovers from dip into 1.0700, but bullish momentum remains thin.
- Pan-European GDP figures met already-low expectations.
- An appearance from ECB President Lagarde and US Retail Sales in the pipe.
EUR/USD found thin footing to stage a rebound from a decline into 1.0700, but the high side is looking far away as the pair remains challenged by bearish flows as the US Dollar (USD) finds broad-market support after US inflation figures on Wednesday spooked market sentiment.
European Gross Domestic Product (GDP) figures met expectations, but a lopsided pan-European economy suffering from lagging growth saw the bar set very close to the floor with investors forecasting a flat growth print.
Daily digest market movers: EUR/USD rebounds from 1.0700, but bearish sentiment weighs heavy
- European GDP printed at 0.0% for the fourth quarter, as expected.
- Annualized quarterly euro area GDP showed slim 0.1% growth for the year through the fourth quarter.
- European Industrial Production showed a healthy uptick to 2.6% in December, well above the forecast -0.2% versus the previous month’s 0.4% (revised from -0.3%).
- Euro (EUR) traders will be keeping an eye out for European Central Bank (ECB) President Christine Lagarde’s appearance slated for early Thursday.
- ECB President Lagarde will be testifying before the European Parliament’s Committee on Economic and Monetary Affairs in Brussels at 08:00 am GMT Thursday.
- US Retail Sales figures are also due Thursday.
- US Retail Sales in January are expected to decline in January, coming in at -0.1% versus the previous month’s 0.6%.
Euro price today
The table below shows the percentage change of Euro (EUR) against listed major currencies today. Euro was the strongest against the Pound Sterling.
| USD | EUR | GBP | CAD | AUD | JPY | NZD | CHF | |
| USD | -0.17% | 0.23% | -0.17% | -0.62% | -0.11% | -0.50% | -0.22% | |
| EUR | 0.18% | 0.40% | 0.01% | -0.44% | 0.04% | -0.31% | -0.02% | |
| GBP | -0.23% | -0.41% | -0.39% | -0.84% | -0.34% | -0.73% | -0.44% | |
| CAD | 0.17% | -0.01% | 0.39% | -0.44% | 0.05% | -0.33% | -0.05% | |
| AUD | 0.60% | 0.44% | 0.83% | 0.44% | 0.48% | 0.12% | 0.39% | |
| JPY | 0.12% | -0.07% | 0.33% | -0.04% | -0.51% | -0.39% | -0.10% | |
| NZD | 0.50% | 0.32% | 0.72% | 0.33% | -0.11% | 0.31% | 0.28% | |
| CHF | 0.20% | 0.03% | 0.43% | 0.06% | -0.40% | 0.09% | -0.29% |
The heat map shows percentage changes of major currencies against each other. The base currency is picked from the left column, while the quote currency is picked from the top row. For example, if you pick the Euro from the left column and move along the horizontal line to the Japanese Yen, the percentage change displayed in the box will represent EUR (base)/JPY (quote).
Technical analysis: EUR/USD recovers to 1.0730 region, further topside limited by technical ceiling
EUR/USD sagged into 1.0700 early Wednesday following Tuesday’s US inflation-fueled tumble, and a near-term recovery sees the pair hampered on the bearish side of the 200-hour Simple Moving Average (SMA) near 1.0760.
EUR/USD is on pace for a fourth straight week of decline, and a bearish Friday close will have the pair close lower for five of the last six consecutive trading weeks. The pair is down around 3.7% from December’s peak bids near 1.1140, and bearish momentum continues to drag the pair further down from the 200-day SMA near 1.0830.
EUR/USD hourly chart
EUR/USD daily chart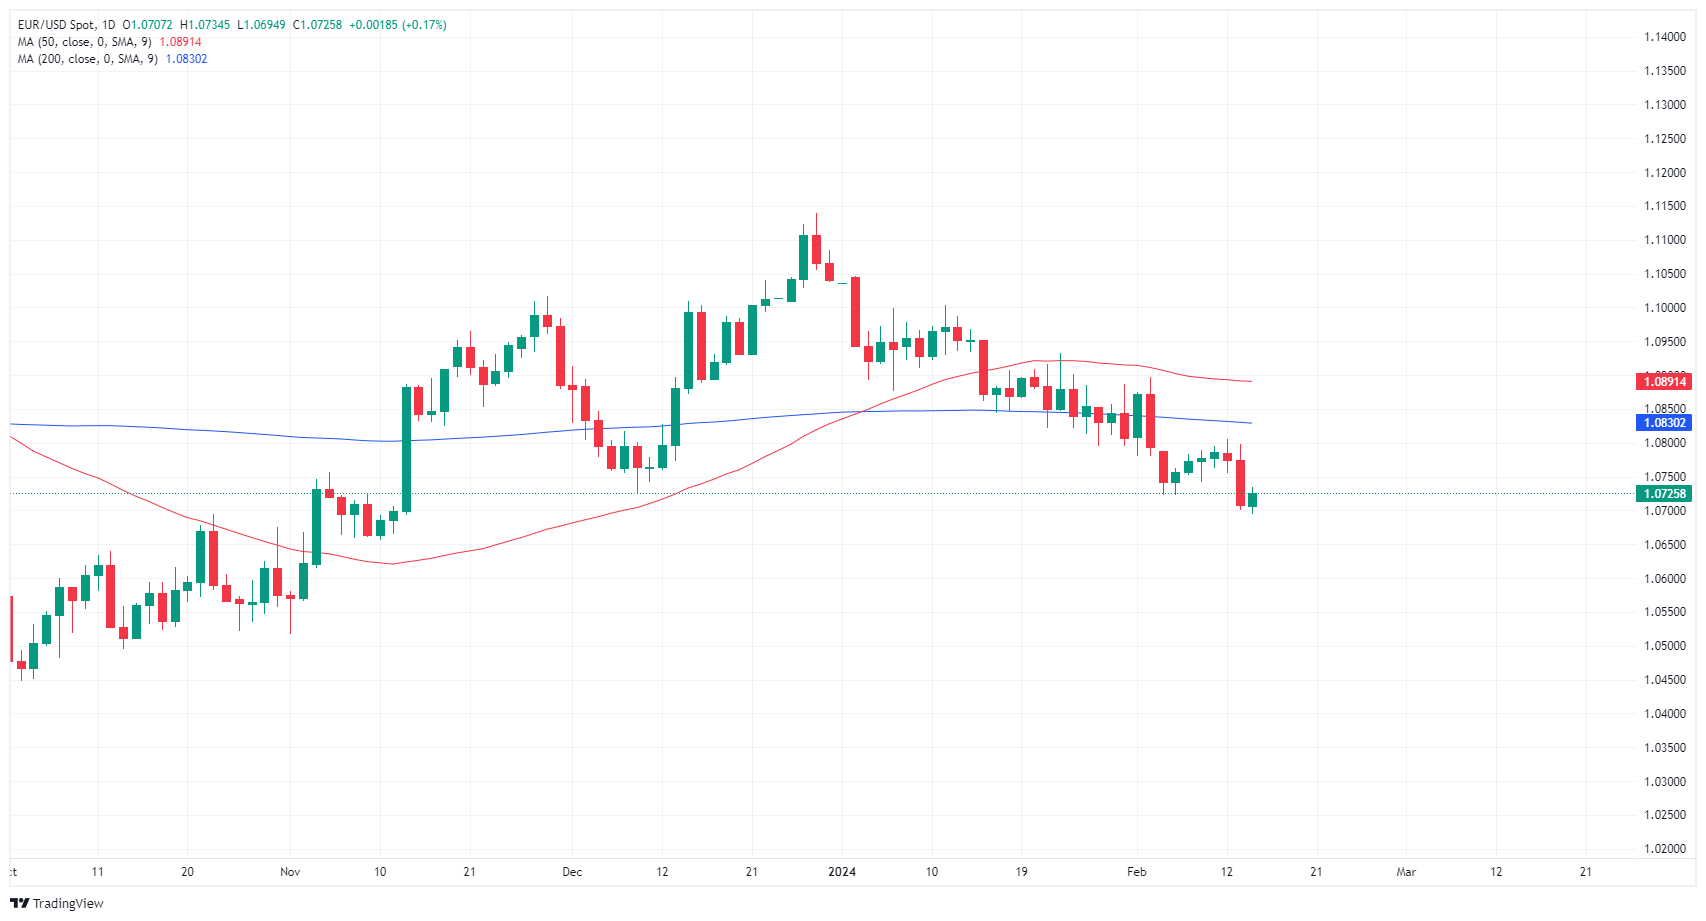
GDP FAQs
A country’s Gross Domestic Product (GDP) measures the rate of growth of its economy over a given period of time, usually a quarter. The most reliable figures are those that compare GDP to the previous quarter e.g Q2 of 2023 vs Q1 of 2023, or to the same period in the previous year, e.g Q2 of 2023 vs Q2 of 2022.
Annualized quarterly GDP figures extrapolate the growth rate of the quarter as if it were constant for the rest of the year. These can be misleading, however, if temporary shocks impact growth in one quarter but are unlikely to last all year – such as happened in the first quarter of 2020 at the outbreak of the covid pandemic, when growth plummeted.
A higher GDP result is generally positive for a nation’s currency as it reflects a growing economy, which is more likely to produce goods and services that can be exported, as well as attracting higher foreign investment. By the same token, when GDP falls it is usually negative for the currency.
When an economy grows people tend to spend more, which leads to inflation. The country’s central bank then has to put up interest rates to combat the inflation with the side effect of attracting more capital inflows from global investors, thus helping the local currency appreciate.
When an economy grows and GDP is rising, people tend to spend more which leads to inflation. The country’s central bank then has to put up interest rates to combat the inflation. Higher interest rates are negative for Gold because they increase the opportunity-cost of holding Gold versus placing the money in a cash deposit account. Therefore, a higher GDP growth rate is usually a bearish factor for Gold price.


-

 Blockchain1 week ago
Crypto execs cheer as Australia appoints pro-crypto assistant minister – Crypto News
-

 Business6 days ago
How Mid-Sized Treasurers Are Managing Liquidity Amid Uncertainty – Crypto News
-

 Blockchain1 week ago
US property manager tokenizes multifamily properties on Chintai blockchain – Crypto News
-

 Blockchain1 week ago
Top Expert Declares It The Best Crypto To Buy Now – Crypto News
-
Business1 week ago
No Truth to Truth Social Memecoin: World Liberty Financial Clarifies – Crypto News
-
others1 week ago
Why Is Crypto Market Down When S&P 500 Flashes Bull Run Ahead? – Crypto News
-

 others1 week ago
Hackers Attempting To Extort School Employees via Email After Millions of Students’ Personal Data Leaked in Breach: Report – Crypto News
-
Business1 week ago
XRP Flips Tether’s USDT By Market Cap Reclaiming 3rd Spot, Price Rally To $3? – Crypto News
-
Business1 week ago
Crypto News: Animoca Brands Eye NYSE Listing Amid Donald Trump’s Crypto Push – Crypto News
-

 others1 week ago
MoonX: BYDFi’s On-Chain Trading Engine — A Ticket from CEX to DEX – Crypto News
-

 others1 week ago
Analyst Sees Crypto Repeating Dot-Com Bubble, Predicts Rallies for XRP and One Solana Challenger – Crypto News
-
Technology1 week ago
XRP Price Prediction as Binance Data Reveals Early Signs Of Bull Run – Crypto News
-
others1 week ago
SEC Crypto Roundtable: Paul Atkins Vows To Make US Crypto Capital Of The World – Crypto News
-

 others1 week ago
Investor Kidnapped, Driven to Remote Desert and Robbed of $4,000,000 in Cryptocurrency by Teenagers: Report – Crypto News
-

 others1 week ago
USD/JPY falls below 148.00 despite persistent uncertainty over BoJ’s policy outlook – Crypto News
-
Metaverse1 week ago
Why AI is central to the new browser wars – Crypto News
-
Business1 week ago
Can WIF Price Hit $2? Pattern Breakout and 100% OI Surge to $445M Signal Major Upside – Crypto News
-

 others1 week ago
AUD/USD gains after softer CPI data from the US and trade developments – Crypto News
-
others1 week ago
Breaking: US SEC Delays Decision on Grayscale Spot Solana and Litecoin ETFs – Crypto News
-

 Technology1 week ago
Best wireless soundbars in 2025: Top 10 picks to elevate your home audio experience – Crypto News
-

 Blockchain1 week ago
10 Signs a Crypto Investment Platform Is a Scam—and How to Avoid It – Crypto News
-
Technology1 week ago
Pi Coin Crashes 33% As Pi Network Community Screams ‘Betrayal’ – Crypto News
-
Business1 week ago
Bitcoin Price Risks Dropping Below $100k As Crypto Liquidations Hit $714M – Crypto News
-
others1 week ago
Pepe Coin Price Outperforms DOGE and SHIB, Targets 80% Upside Post-Retest – Crypto News
-
Blockchain1 week ago
Top Expert Declares It The Best Crypto To Buy Now – Crypto News
-

 Technology1 week ago
iQOO Neo 10 vs Motorola Edge 60 Pro: Which smartphone to buy under Rs.35000 – Crypto News
-

 others1 week ago
Silver trims early gains, holds above 50-day EMA as weak US CPI tempers Fed tightening bets – Crypto News
-
Cryptocurrency1 week ago
Ripple (XRP) Price Analysis: $5.5 Billion XRP Open Interest Signals Positive Reaction to Paul Atkins’ Latest Update – Crypto News
-
Business1 week ago
Ripple (XRP) Price Analysis: $5.5 Billion XRP Open Interest Signals Positive Reaction to Paul Atkins’ Latest Update – Crypto News
-
Technology1 week ago
Ripple (XRP) Price Analysis: $5.5 Billion XRP Open Interest Signals Positive Reaction to Paul Atkins’ Latest Update – Crypto News
-

 Blockchain1 week ago
Alarm bells ring in US over OpenAI’s crypto project World – Crypto News
-

 others1 week ago
Tests 100.50 support, with nine-day EMA providing backing – Crypto News
-
Business1 week ago
COIN Stock Soars 23% Ahead of Coinbase’s May 19 Debut on S&P 500 – Crypto News
-

 Cryptocurrency1 week ago
Why investors should say ‘no’ more often – Crypto News
-
Cryptocurrency1 week ago
Why investors should say ‘no’ more often – Crypto News
-
![Nifty 50 Index Elliott Wave technical analysis [Video]](https://dripp.zone/news/wp-content/uploads/2025/05/Nifty-50-Index-Elliott-Wave-technical-analysis-Video-Crypto-400x240.jpg)
![Nifty 50 Index Elliott Wave technical analysis [Video]](https://dripp.zone/news/wp-content/uploads/2025/05/Nifty-50-Index-Elliott-Wave-technical-analysis-Video-Crypto-80x80.jpg) others1 week ago
others1 week agoNifty 50 Index Elliott Wave technical analysis [Video] – Crypto News
-

 others6 days ago
Crypto Trader Prints 517x Profit on Solana-Based Altcoin That’s Exploded 7,000% in Just One Week: Lookonchain – Crypto News
-

 Blockchain6 days ago
Stablecoin bill passes in Northern Marianas as House overrides veto – Crypto News
-
others6 days ago
Dogecoin On-Chain Metrics Hint At DOGE Mega Rally Ahead – Crypto News
-

 Blockchain6 days ago
Solana Poised For Upside Move After A Bounce From $168 – Crypto News
-
others6 days ago
XRP Futures ETF Goes Live on May 19: Will It Beat ETH And BTC Debut? – Crypto News
-

 Cryptocurrency6 days ago
Top crypto to buy as Saudi Central Bank reveals exposure to MSTR – Crypto News
-

 Cryptocurrency6 days ago
UK confirms crypto tax data rules under CARF; first deadline set for May 2027 – Crypto News
-

 Technology6 days ago
Coinbase estimates $400M cost after data breach and crypto scam – Crypto News
-
Business5 days ago
World Liberty Financial Partners Chainlink To Enable USD1 Stablecoin Cross-Chain Transfers – Crypto News
-

 Blockchain5 days ago
Bitcoin Panic Buying? Eric Trump Says the World Is Stockpiling BTC – Crypto News
-

 Cryptocurrency5 days ago
Ripple’s XRP may enable BRICS to ditch dollar and settle trade in gold – Crypto News
-
Technology5 days ago
XRP Price Impact If GENIUS Act Boosts Ripple’s RLUSD Market Cap to 50% of Tether’s $150B – Crypto News
-

 Cryptocurrency1 week ago
XRP Price Nears $2.50 Support As Fundamentals Bring Record Highs In Sight – Crypto News
-

 Technology1 week ago
Samsung Galaxy Z Fold 7 tipped to outsize last-gen Z Fold 6: Check details – Crypto News