


Technology
$LTC Bullish Reversal in Sight as Whale Buying Heats Up – Crypto News
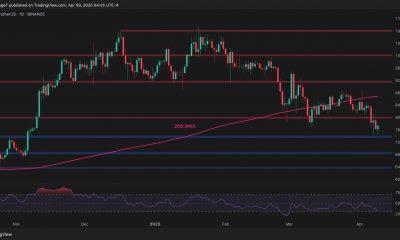
Litecoin Price Analysis: Amid the recent market consolidation, the Litecoin price showcased a notable resilience above the $74.5 support. The daily chart projecting long-wick rejection candles at this support indicates the buyers are actively accumulating this asset at a discounted price. With the Bitcoin price jumping above $65000 on Monday, a majority of major altcoins, including LTC show higher potential to reclaim lost ground.
Also Read: Top 4 Crypto Picks for May 2024: BDAG, LTC, AVAX, & ADA
Litecoin Targets $100 as Bullish Patterns Emerge

Over the past two months, Litecoin’s daily chart has shown a huge price swing from $113 to $74.5 levels, but only extending sideways. While this consolidation showcases a lack of indication from buyers to sellers, the asset has managed to hold its value above $74.5.
The coin price has rebounded from the aforementioned support three times during the recent consolidation trend, indicating that buyers have not given up on this asset. A recent reversal from $74.5 has uplifted the asset by 9% to currently trade at $81.5.
Recent data from Santiment, highlighted by trader Kamikaze, reveals intriguing insights into Litecoin (LTC) market dynamics. Despite a decline in Bitcoin’s price, substantial accumulation by whale investors suggests a potential long-term bullish sentiment among key holders.
Although the price of #Litecoin has fallen, data from @santimentfeed shows that whales purchased an additional 100,000 LTC between April 28th and May 4th. This counter-trend behavior suggests potential long-term bullish sentiment among major holders.$LTC #Crypto pic.twitter.com/VbqMrYUwIP
— 山丨ㄥㄥ Trader_Kamikaze 🇧🇷 🤘 (@trader_kamikaze) May 5, 2024
Between April 28th and May 4th, whales added an additional 100,000 LTC to their holdings. This counter-trend behavior, as depicted in the accompanying chart, indicates a possible shift in sentiment among major holders, potentially signaling a positive outlook for Litecoin in the future.
If the bullish momentum persists, the LTC price could gain another 8.6% and develop a bullish reversal pattern called a double-bottom. A breakout above the $88.6 neckline which is also the last swing high will signal an initial signal of trend reversal.
A post-breakout rally could push the LTC price to a potential target of $100, followed by $112.
Technical Indicator:
- Exponential Moving Average: A potential bearish crossover between the 20-and-100-day EMA may accelerate the selling momentum and extend current consolidation.
- Relative Strength Index: The daily RSI wavering at 44% indicates a neutral to bearish sentiment in the market.
Related Articles
The presented content may include the personal opinion of the author and is subject to market condition. Do your market research before investing in cryptocurrencies. The author or the publication does not hold any responsibility for your personal financial loss.


-

 Blockchain6 days ago
The CFO and Treasurer’s Guide to Digital Assets – Crypto News
-

 Cryptocurrency1 week ago
Famous Crypto Analyst Advises to Sell NVIDIA Stock: Here’s Why – Crypto News
-

 Business1 week ago
Binance Enables Apple & Google Pay Features With This Latest Partnership – Crypto News
-

 Cryptocurrency1 week ago
Tariffs Are Just the Tip of the Iceberg, Warns Billionaire Investor Ray Dalio – Crypto News
-

 Cryptocurrency1 week ago
BitMEX Study Reveals Exchange-Specific Price Trends for Perpetual Swaps Across Leading Exchanges – Crypto News
-

 Technology1 week ago
Apple could give iPhone a radical makeover for its 20th anniversary, report says – Crypto News
-

 Business1 week ago
Will Dogecoin Price Ever Reach $1? Top Analysts Weigh In – Crypto News
-

 Cryptocurrency1 week ago
Dire Wolf Solana Meme Coin Soars to $13.6M Market Cap After ‘De-Extinction’ – Crypto News
-

 Technology1 week ago
Apple exported iPhones worth ₹1.5 trillion from India in FY25: Union Minister Ashwini Vaishnaw – Crypto News
-

 others1 week ago
John Deaton Highlights Ripple’s Journey from Legal Struggle To ETF Launches – Crypto News
-
 Technology1 week ago
Can It Take The Baton And Initiate The Next Altcoin Rally As The Market Strengthens? – Crypto News
-

 Cryptocurrency1 week ago
The Downside Prevails As Cardano Price Rejected at $0.60 – Crypto News
-

 Cryptocurrency1 week ago
Dogecoin hits multi-month low, but is a market reset on the way? – Crypto News
-

 Technology1 week ago
Musks DOGE using AI to snoop on U.S. federal workers, sources say – Crypto News
-

 Cryptocurrency1 week ago
ETH Hits 2-Year Low as BTC, XRP Hold Support – Crypto News
-

 Cryptocurrency1 week ago
Peter Schiff Cautions US Against Trade War Escalation With China – Crypto News
-

 Blockchain6 days ago
How to mine Bitcoin at home in 2025: A realistic guide – Crypto News
-

 Technology1 week ago
iPad Air M3 (2025) Review: Still the most practical iPad – Crypto News
-

 Business1 week ago
Cathie Wood’s Ark Invest Loads $13 Million of Coinbase Stock, COIN Price Reversal Soon? – Crypto News
-

 others1 week ago
Australia Shuts Over 90 Companies Linked To Pig Butchering Schemes – Crypto News
-

 Business1 week ago
“Perfect Time to Buy” – Patterns Point to a Pepe Coin Price Resurgence – Crypto News
-

 Cryptocurrency1 week ago
Bitcoin is highly correlated with stock market since August 2024 – Crypto News
-
 Business1 week ago
Sui Price Recovers As CBOE Files To List SUI ETF – Crypto News
-

 Technology6 days ago
Microsoft’s Greatest Hits and Epic Fails: A 50-Year Wild Ride – Crypto News
-

 Blockchain1 week ago
Cardano (ADA) Eyes Resistance Break—Failure Could Spark Fresh Losses – Crypto News
-

 Technology1 week ago
PumpFun Livestream Feature Is Back — But What’s Changed? – Crypto News
-
 Business1 week ago
Is Ripple Hinting at Cardano Partnership? – Crypto News
-

 Blockchain1 week ago
Cathie Wood’s ARK bags $26M in Coinbase shares, unloads Bitcoin ETF – Crypto News
-

 Technology1 week ago
China Retaliates, Triggering a Dead Cat Bounce in Crypto – Crypto News
-

 Business1 week ago
Solana Unveils Confidential Balances Token Extension – Crypto News
-
 others1 week ago
Top 3 Reasons XRP Price May Surge as Analyst Delivers a $693 Billion Prediction – Crypto News
-
 Cryptocurrency1 week ago
BTC Risks Further Downside if it Fails to Reclaim This Resistance – Crypto News
-

 Cryptocurrency1 week ago
OpenAI Countersues Elon Musk, Accuses Billionaire of ‘Bad-Faith Tactics’ – Crypto News
-

 Blockchain6 days ago
BTC, ETH, XRP, BNB, SOL, DOGE, ADA, LEO, LINK, AVAX – Crypto News
-

 Technology6 days ago
Dogecoin Price Gearing for A 3X Rally Amid DOGE Whale Accumulation – Crypto News
-

 others5 days ago
Binance Issues Important Update On 10 Crypto, Here’s All – Crypto News
-

 others1 week ago
WTI price mostly unchanged at European opening – Crypto News
-

 others1 week ago
Technical Indicator Suggesting Bitcoin (BTC) Bull Market Hasn’t Started Yet: Quant Analyst PlanB – Crypto News
-

 others1 week ago
Gold price under pressure despite high risk aversion – Commerzbank – Crypto News
-

 Technology1 week ago
Shiba Inu Price Risks 50% Crash As Bearish Breakout Looms – Crypto News
-

 Blockchain1 week ago
Web3 active developers drop nearly 40% in one year – Crypto News
-

 Blockchain1 week ago
XRP Down, But History Says Millionaires Were Made This Way – Crypto News
-

 others1 week ago
Economist Alex Krüger Warns US Stocks Could Repeat 2008 Bear Market Amid Trump’s Trade War – Crypto News
-

 Technology1 week ago
XRP Leveraged ETF Outshines Solana At Launch – Crypto News
-

 Cryptocurrency1 week ago
Stablecoin infrastructure platform M^0 expands to Solana – Crypto News
-
Blockchain1 week ago
Investors Looking To Buy Bitcoin? – Crypto News
-

 Cryptocurrency1 week ago
Galaxy’s imminent US listing reflects SEC change – Crypto News
-

 others1 week ago
Crypto Products See $240,000,000 in Outflows Likely in Response to US Tariff Threats: CoinShares – Crypto News
-

 Blockchain7 days ago
NY attorney general urges Congress to keep pensions crypto-free — ‘No intrinsic value’ – Crypto News
-

 Technology7 days ago
iQOO Z10 5G, Z10x 5G launched in India, price starts at ₹13,499. Check full price, specs and more – Crypto News
✓ Share: