


Cryptocurrency
Mantra hits new highs at $9.17 – Can OM move beyond $10? – Crypto News
![]()
Journalist
Posted: February 23, 2025
- Mantra is up 133% YTD and rising.
- The recent gains have a pattern of consolidation and expansion on the lower timeframes.
Mantra [OM] has shown unstoppable momentum over the past year. Compared to the price on the 1st of February, OM was up by 8,592%, or nearly 86x at press time. Even from the 1st of January, OM was up by 133%.
This has come at a time when the rest of the market has fallen lower or stayed range-bound, such as Ethereum [ETH] or Bitcoin [BTC]. It has set a series of new all-time highs, with the latest being $9.17.
The psychological $10 level is likely to be breached next.
How high can OM go?
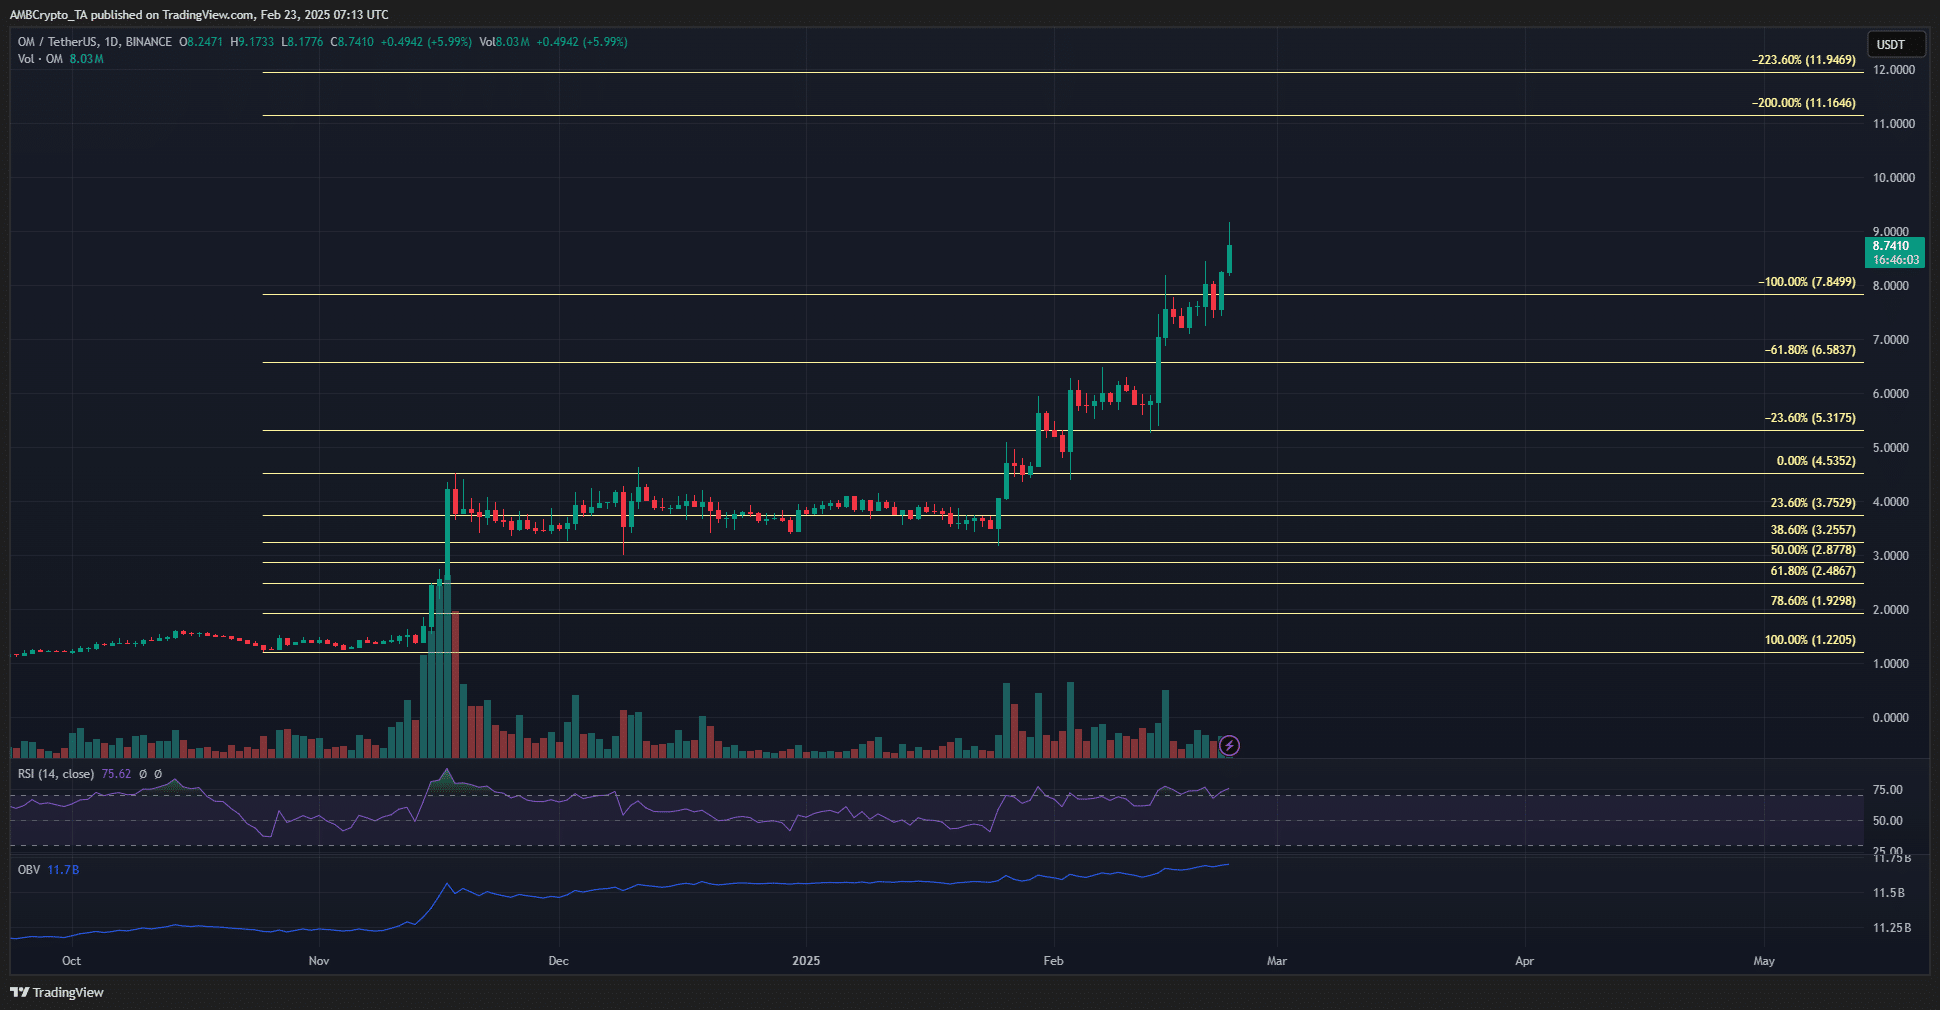
Source: OM/USDT on TradingView
Based on the rally in November, a set of Fibonacci retracement and extension levels were plotted.
Beyond the $4.5 high from that rally, the relevant extension levels at $5.31, $6.58, and $7.84 have acted as both resistance and support.
If this trend continues, the next price targets will be $11.16 and $11.94. Since Mantra has not seen a sizable retracement phase, the extension levels from November continue to serve their purpose.
The RSI did not show a bearish divergence on the daily timeframe, but it was getting closer. The price has formed higher highs, but the RSI struggled to match them.
This could be an early warning of a lower timeframe pullback. Also, the OBV continued to rise higher, showing persistent buying pressure.
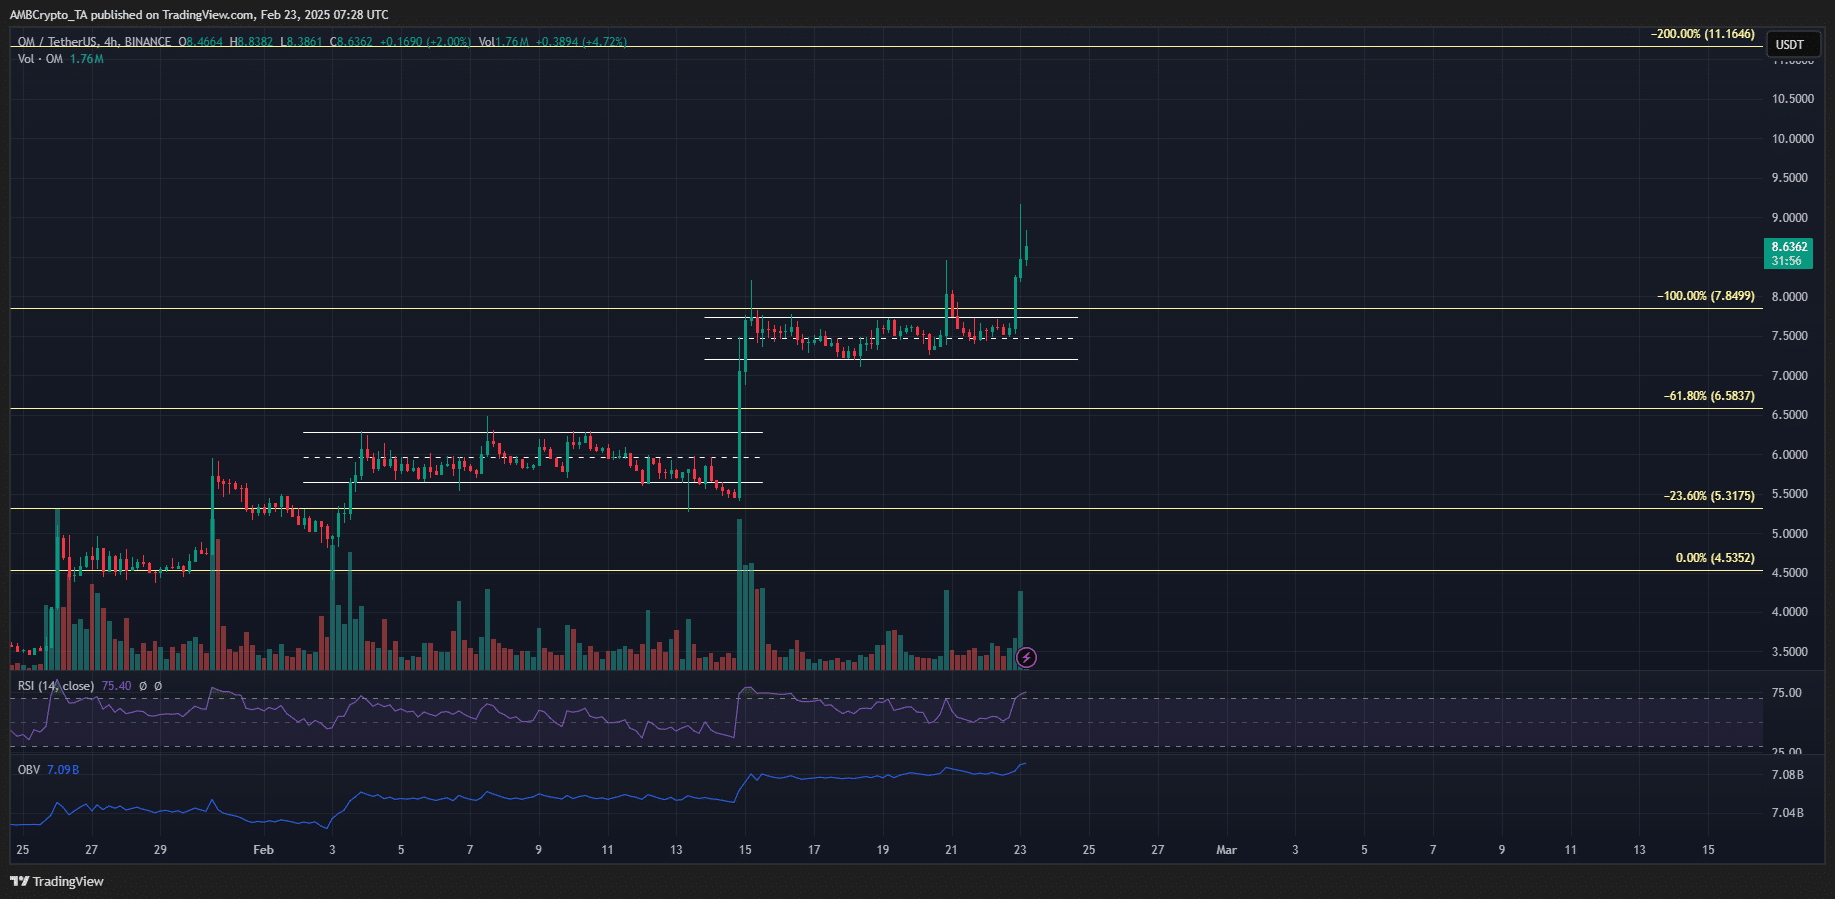
Source: OM/USDT on TradingView
It is possible for traders to capitalize on the relentless OM momentum. The rallies in February were preceded by a range formation, highlighted in white.
In the second week of February, a deviation below the range low was followed by a swift 50% price move.
The range formation which OM broke out of recently originated at the mid-range level.
Hence, traders can wait for the next range formation and try to buy the altcoin at the range lows, after a liquidity pocket has been built and swept.
However, this could prove to be risky, and traders shouldn’t hesitate to cut the trade if the structure began to shift.
Disclaimer: The information presented does not constitute financial, investment, trading, or other types of advice and is solely the writer’s opinion


-

 Technology1 week ago
Chip Designer Arm Plans to Become Chip Manufacturer – Crypto News
-

 Cryptocurrency3 days ago
SUI eyes 24% rally as bullish price action gains strength – Crypto News
-

 others6 days ago
Japanese Yen remains depressed amid modest USD strength; downside seems limited – Crypto News
-

 Technology1 week ago
MacBook Air M3 15-inch model gets a ₹12,000 price drop on Amazon: Deal explained – Crypto News
-

 Cryptocurrency2 days ago
Coinbase scores major win as SEC set to drop lawsuit – Crypto News
-
others1 week ago
Japan Foreign Investment in Japan Stocks declined to ¥-384.4B in February 7 from previous ¥-315.2B – Crypto News
-

 Technology1 week ago
Perplexity takes on ChatGPT and Gemini with new Deep Research AI that completes most tasks in under 3 minutes – Crypto News
-

 Technology1 week ago
Lava Pro Watch X with 1.44-inch AMOLED display, in-built GPS launched in India at ₹4,499 – Crypto News
-

 Blockchain6 days ago
XRP Set To Outshine Gold? Analyst Predicts 1,000% Surge – Crypto News
-

 Cryptocurrency1 week ago
Advisers on crypto: Takeaways from another survey – Crypto News
-

 others1 week ago
Remains subdued below 1.4200 near falling wedge’s lower threshold – Crypto News
-

 Cryptocurrency1 week ago
0xLoky Introduces AI-powered Intel for Crypto Data & On-chain Insights – Crypto News
-

 Technology1 week ago
Factbox-China’s AI firms take spotlight with deals, low-cost models – Crypto News
-

 Technology1 week ago
Massive price drops on Samsung Galaxy devices: Up to ₹10000 discount on Watch Ultra, Tab S10 Plus, and more – Crypto News
-

 Cryptocurrency1 week ago
Tether Acquires a Minority Stake in Italian Football Giant Juventus – Crypto News
-

 Blockchain1 week ago
XRP To 3 Digits? The ‘Signs’ That Could Confirm It, Basketball Analyst Says – Crypto News
-

 others1 week ago
Australian Dollar jumps to highs since December on USD weakness – Crypto News
-

 Technology1 week ago
Weekly Tech Recap: JioHotstar launched, Sam Altman vs Elon Musk feud intensifies, Perplexity takes on ChatGPT and more – Crypto News
-

 Technology1 week ago
What will it take for India to become a global data centre hub? – Crypto News
-

 Technology1 week ago
ChatGPT vs Perplexity: Sam Altman praises Aravind Srinivas’ Deep Research AI; ‘Proud of you’ – Crypto News
-

 Blockchain1 week ago
NEAR Breaks Below Parallel Channel: Key Levels To Watch – Crypto News
-

 Blockchain7 days ago
Will BTC Rebound Or Drop To $76,000? – Crypto News
-

 Blockchain7 days ago
XRP Price Settles After Gains—Is a Fresh Upside Move Coming? – Crypto News
-

 Metaverse6 days ago
How AI will divide the best from the rest – Crypto News
-

 Business6 days ago
What Will be KAITO Price At Launch? – Crypto News
-

 Business6 days ago
Elon Musk’s DOGE Launches Probe into US SEC, Ripple Lawsuit To End? – Crypto News
-

 Blockchain6 days ago
XRP Price Pulls Back From Highs—Are Bulls Still in Control? – Crypto News
-

 Business5 days ago
Whales Move From Shiba Inu to FXGuys – Here’s Why – Crypto News
-

 Technology1 week ago
Best phones under ₹20,000 in February 2025: Poco X7, Motorola Edge 50 Neo and more – Crypto News
-

 Blockchain1 week ago
Popular Investor Says Memecoin More Superior With ‘World’s Best Chart’ – Crypto News
-
 Cryptocurrency1 week ago
Who is Satoshi Nakamoto, The Creator of Bitcoin? – Crypto News
-

 Technology1 week ago
Grok 3 is coming! Elon Musk announces launch date, promises ‘smartest AI on Earth’ – Crypto News
-

 Technology7 days ago
Union Minister Ashwini Vaishnaw to launch India AI Mission portal soon, 10 companies set to provide 14,000 GPUs – Crypto News
-

 Business6 days ago
These 3 Altcoins Will Help You Capitalize on Stellar’s Recent DIp – Crypto News
-

 others6 days ago
Forex Today: What if the RBA…? – Crypto News
-
 Cryptocurrency5 days ago
Hayden Davis crypto scandal deepens as LIBRA memecoin faces fraud allegations – Crypto News
-

 Technology5 days ago
Luminious inverters for your home to never see darkness again – Crypto News
-

 Technology3 days ago
Stellantis Debuts System to Handle ‘Routine Driving Tasks’ – Crypto News
-

 Metaverse1 week ago
Strange Love: why people are falling for their AI companions – Crypto News
-
 Technology1 week ago
Former Google CEO warns of ‘Bin Laden scenario’ for AI: ‘They could misuse it and do real harm’ – Crypto News
-

 Cryptocurrency1 week ago
Yap-to-earn takes over Twitter – Blockworks – Crypto News
-
 Cryptocurrency1 week ago
Someone Just Won $100K in Bitcoin From a $50 Pack of Trading Cards – Crypto News
-

 Technology1 week ago
Cyber fraud alert: Doctor duped of ₹15.50 lakh via fake trading app; here’s what happened – Crypto News
-

 Cryptocurrency1 week ago
Crypto narratives as we await next market move – Crypto News
-
 Business1 week ago
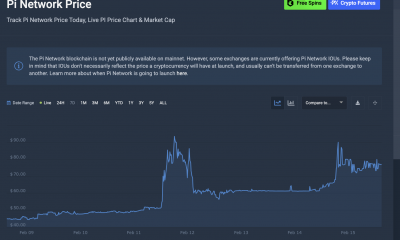
How Will It Affect Pi Coin Price? – Crypto News
-

 Cryptocurrency1 week ago
GameStop Stock Price Pumps After Report of Bitcoin Buying Plans – Crypto News
-

 Blockchain1 week ago
XRP Bullish Pennant Targets $15-$17 But Confirmation Is Required – Crypto News
-
 Business6 days ago
Why Ethereum (ETH) Price Revival Could Start Soon After Solana Mess? – Crypto News
-
 Business6 days ago
Market Veteran Predicts XRP Price If Ripple Completes Cup and Handle Pattern – Crypto News
-

 Cryptocurrency6 days ago
Bitcoin Sees $430M in Outflows as Market Responds to Fed’s Hawkish Stance – Crypto News