


others
Meta: More comprehensive – Crypto News
S2N spotlight
Today we will focus on META for a more comprehensive look. If you haven’t worked out by now, I am a very punny guy. I love dropping them. META has been up an incredible 20 consecutive days, the most for any of the magnificent 7 companies.
I guess before we continue the spotlight, I might as well unpack how rare this is. If we were talking a normal distribution in the truest sense of the word, i.e., with an average of 50% up and down, then getting 20 up in a row would be a one in a million probability.
However, anyone who has worked with financial time series will know that they are not so normal. Stocks have memory, at least more than my grandmother towards the end. Let’s get the Geeky stuff out of the way. I have added the results of 3 normality tests to the chart. META is not normal; then again, who is these days? I would likely fail all 3 tests myself.
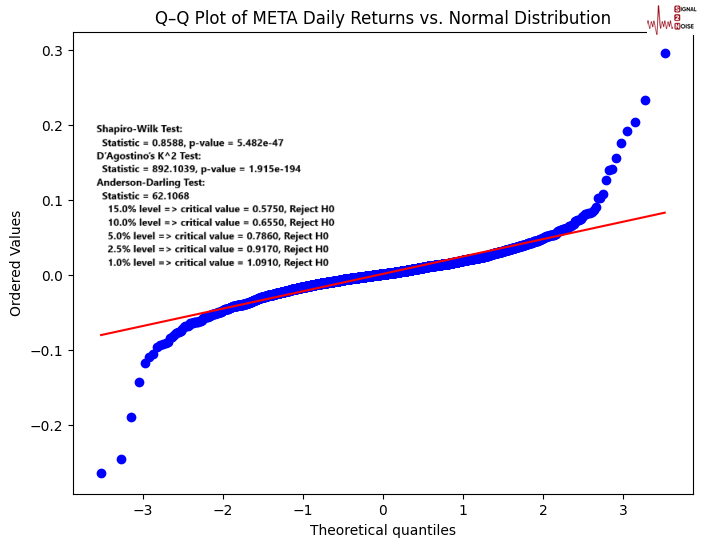
The bottom line is META has up days on average 52.5% of the time. The probability of getting 20 consecutive up days with our non-normal distribution is 1 in 389,000. That was a wordy way of saying this is rare.
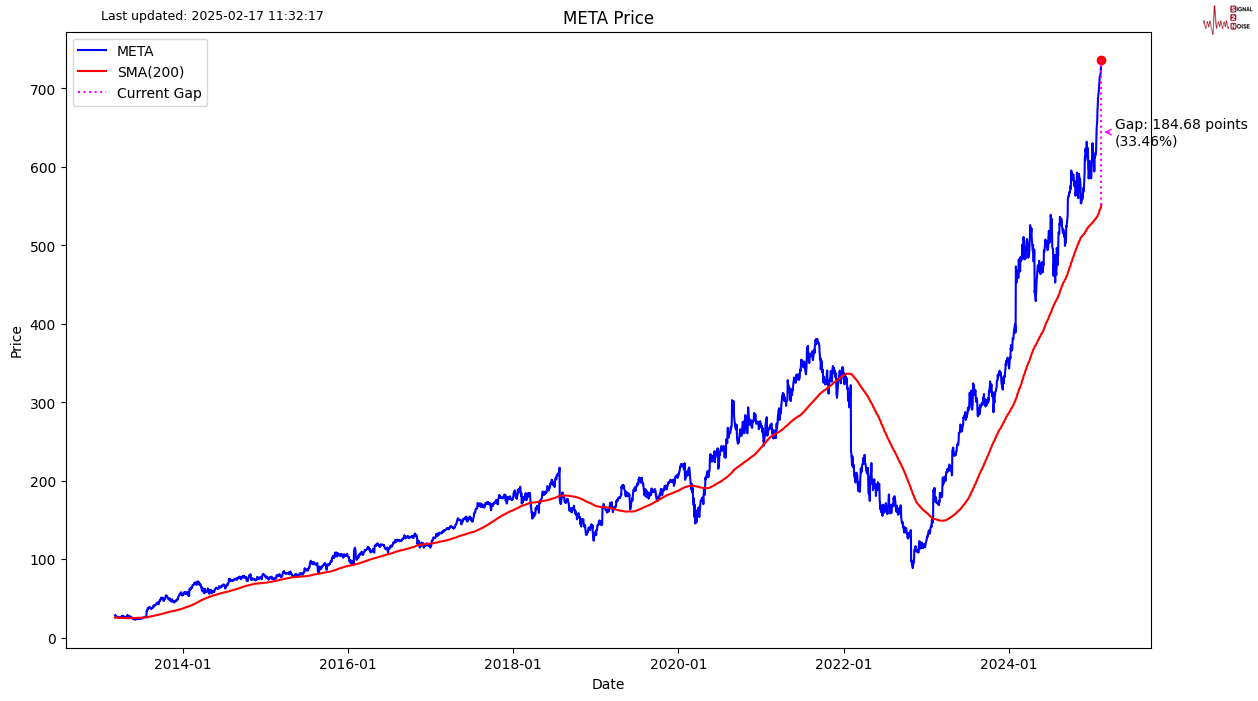
Take a look at the distance of the current price from its 200-day moving average. 33% is bigger than anything we have seen in the past. A gap like that could easily swallow an X. Shots fired Elon.
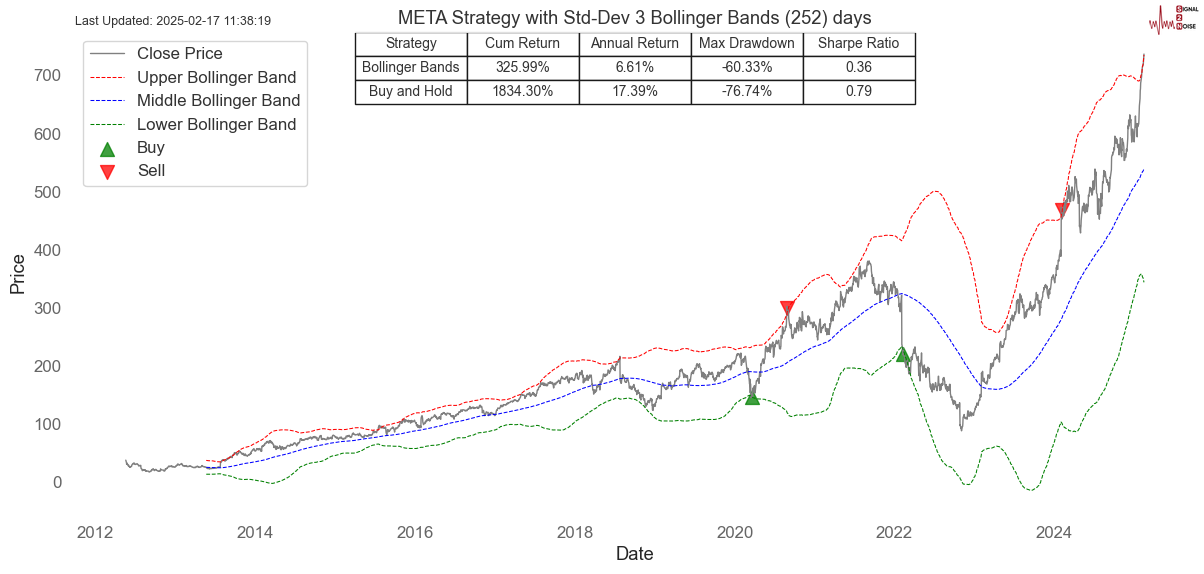
Let us take another look at how far META’s share price has moved. It is about to hit the 3 standard deviation upper Bollinger band. This has only happened twice in the past. I share a strategy below that trades such extremes. You would be better off never trading this strategy if you want to make money and avoid dying of boredom waiting for a signal that turns out not to be as good as you would think.
Let us go a bit deeper. This strategy looks for a more short-term overbought strategy with a 100-day RSI above 95. This has only happened 3 times. We got the 3rd signal last week. If you sell now and hold for a month, you would lose money.
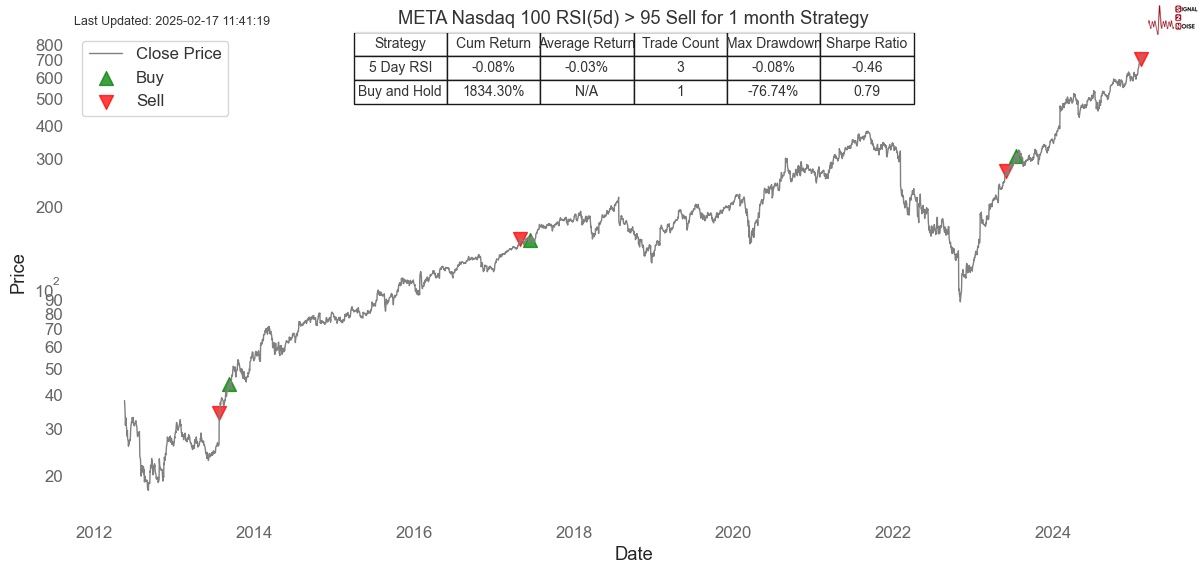
With all that I have said, I have shown we are in a very rare overbought situation. I would certainly look to short META for a few days with this current overbought setup. The probability of more consecutive up days is getting exponentially more unlikely, favouring a short. The trader in me is keen; this is not financial advice.
S2N observations
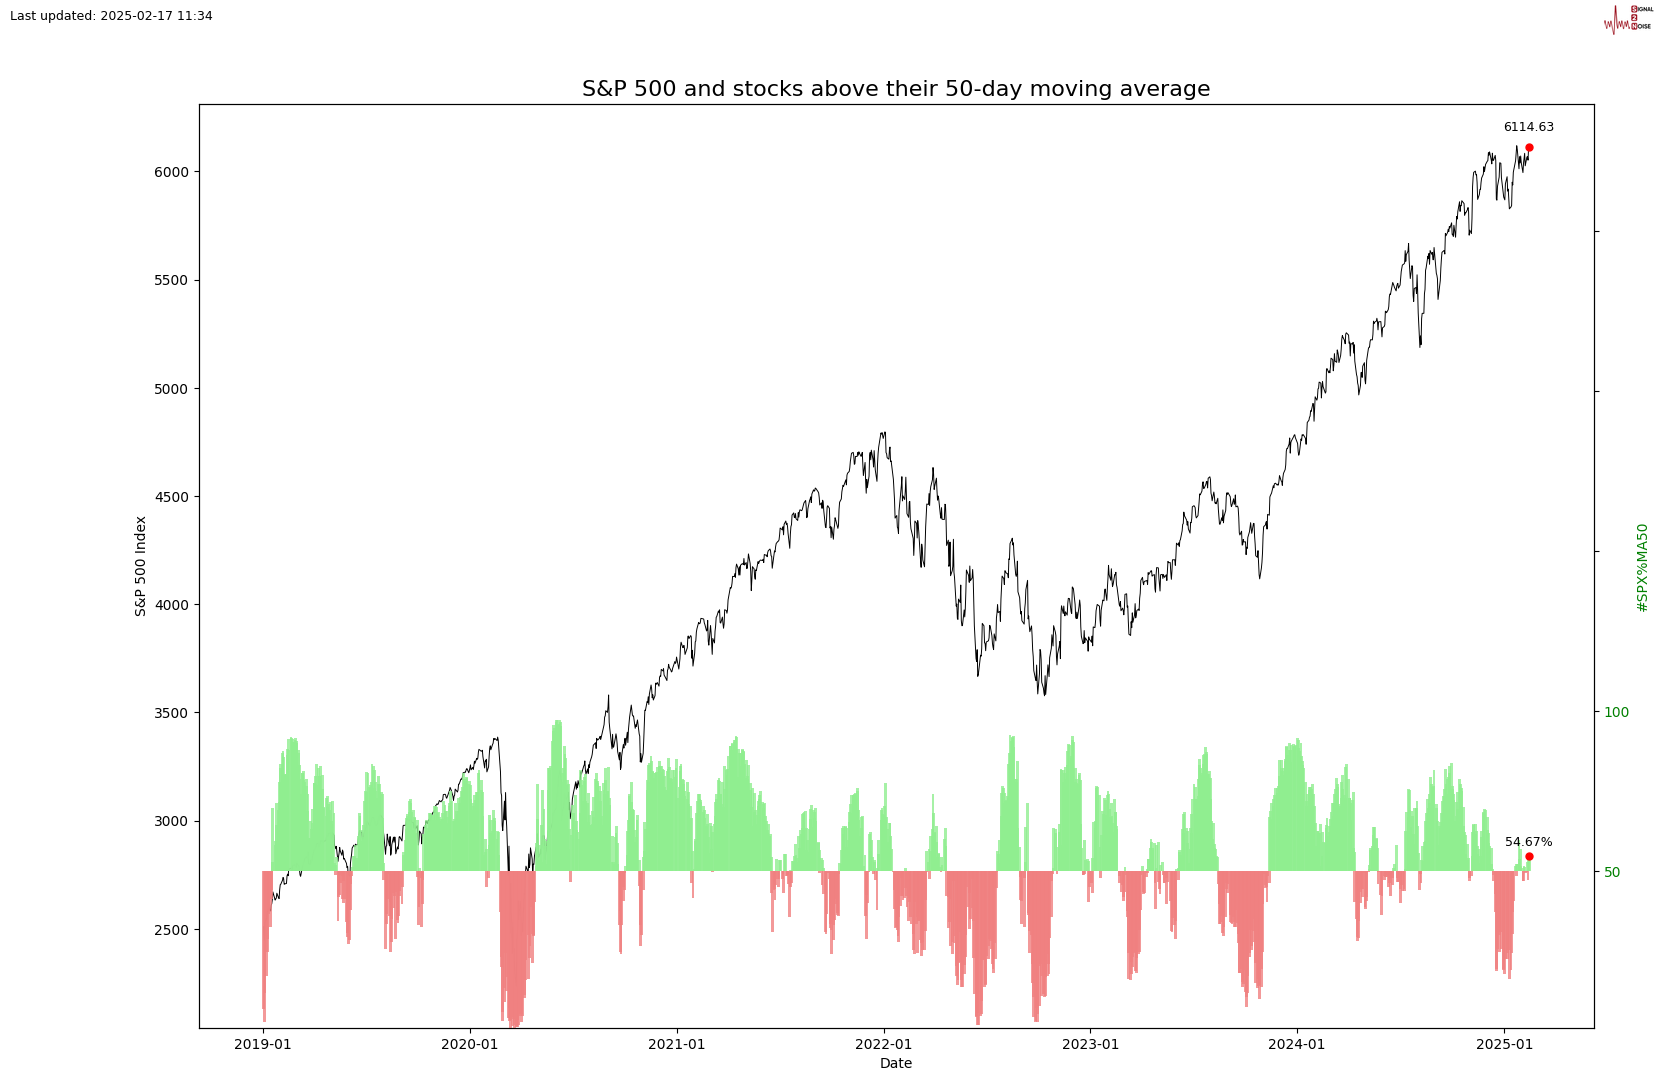
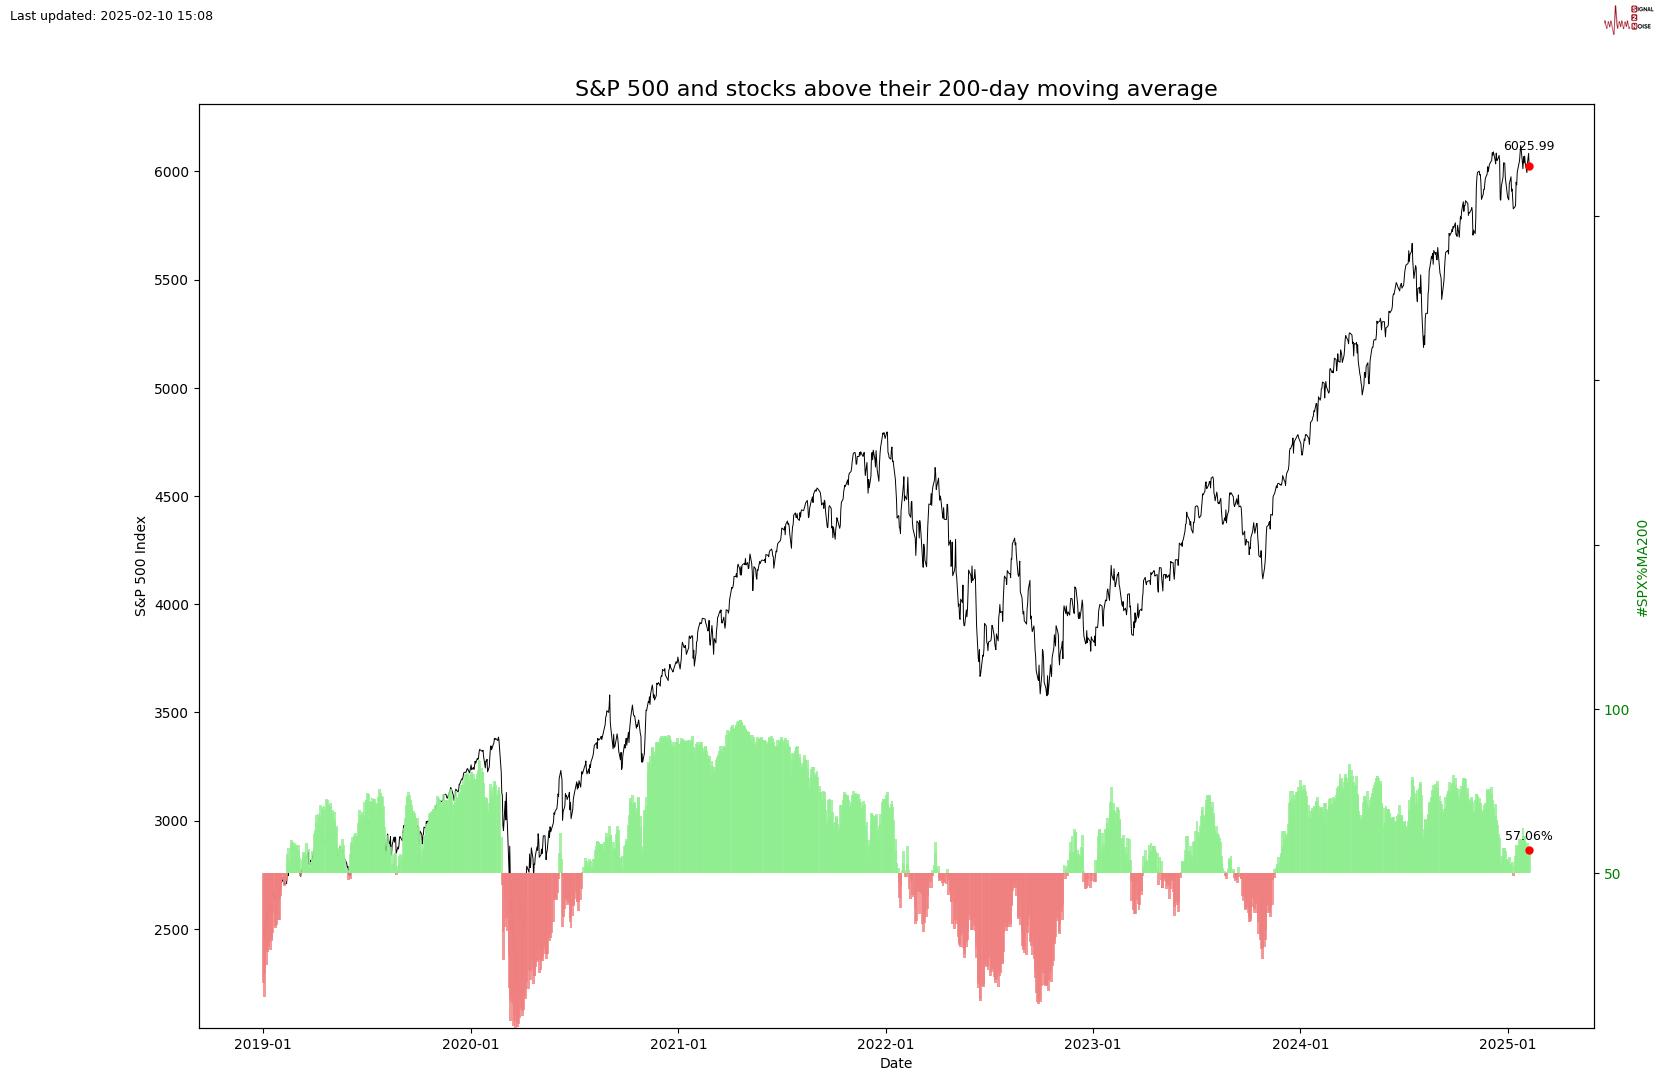
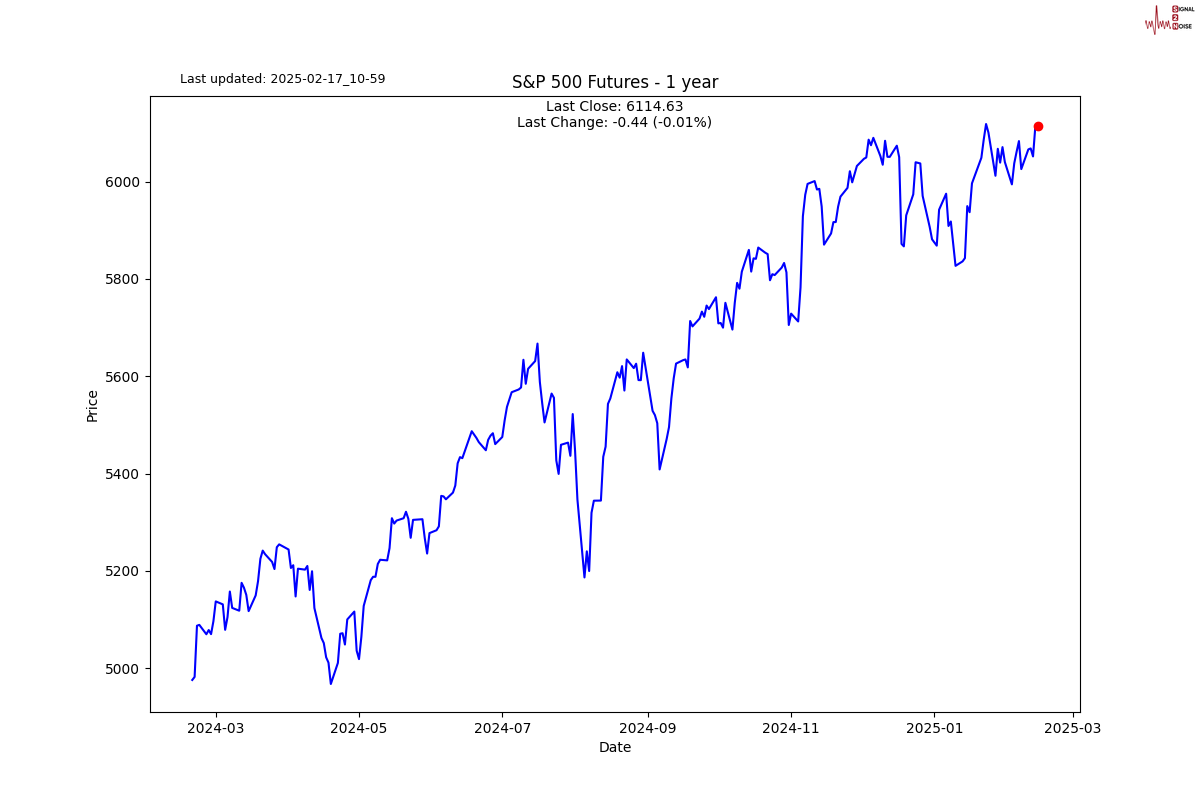
I have said on a number of occasions that I think the S&P 500 will end the year below where it started the year. We are close to another all-time high. As you can see below, the market breadth is still positive, with more than 50% of companies in the S&P 500 above their 50-day and 200-day moving averages. We are likely to see some more upside during the week. The US markets are closed today.
S2N screener alerts
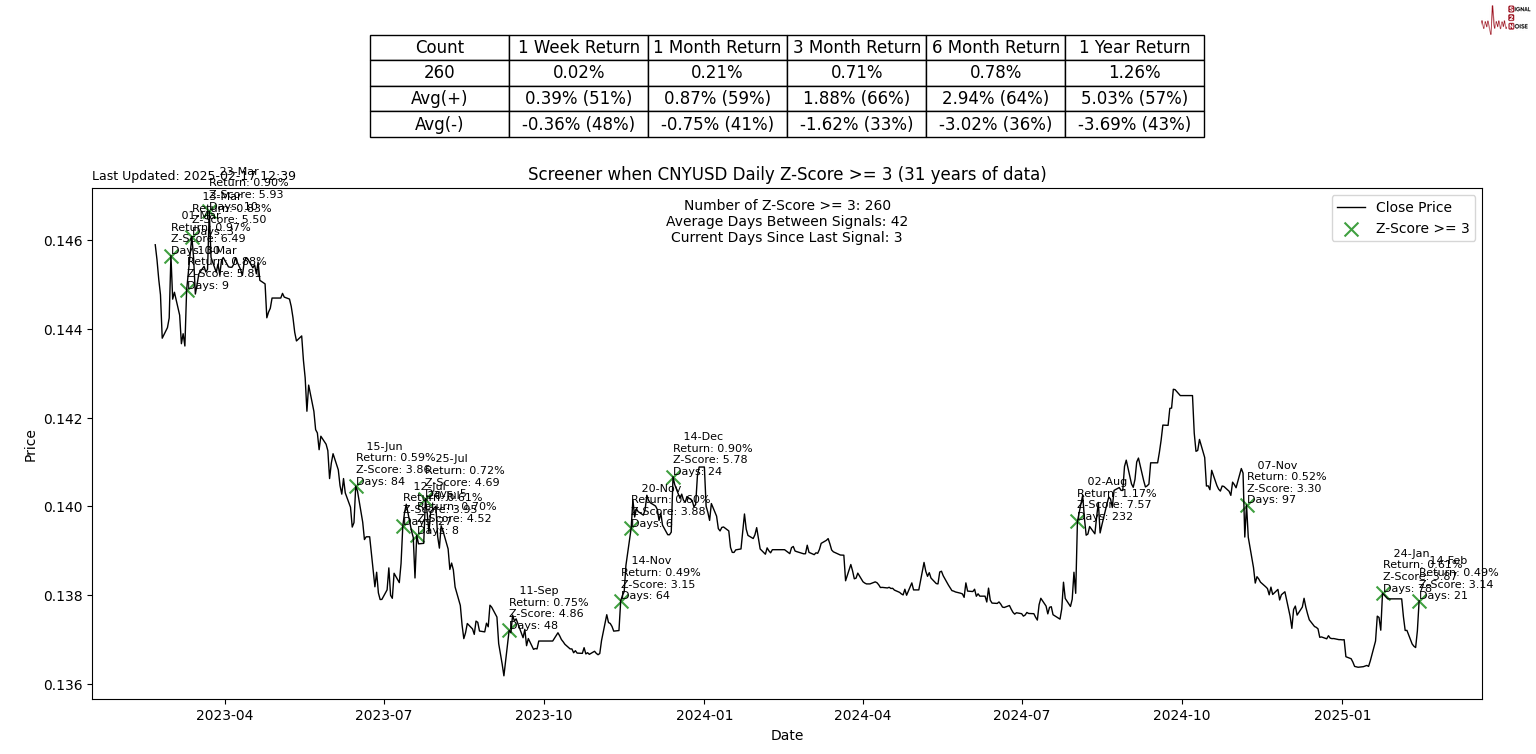
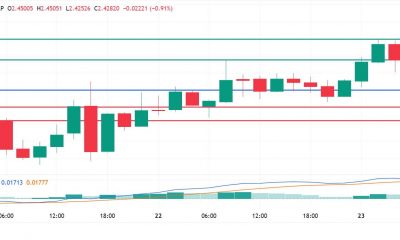
The Chinese Renminbi has a rare 3-sigma up day on Friday. The return may have only been 0.49%, but the Z-Score tells us this is rare given its history of 31 years. Tarriff wars are fast becoming currency wars.
Performance review
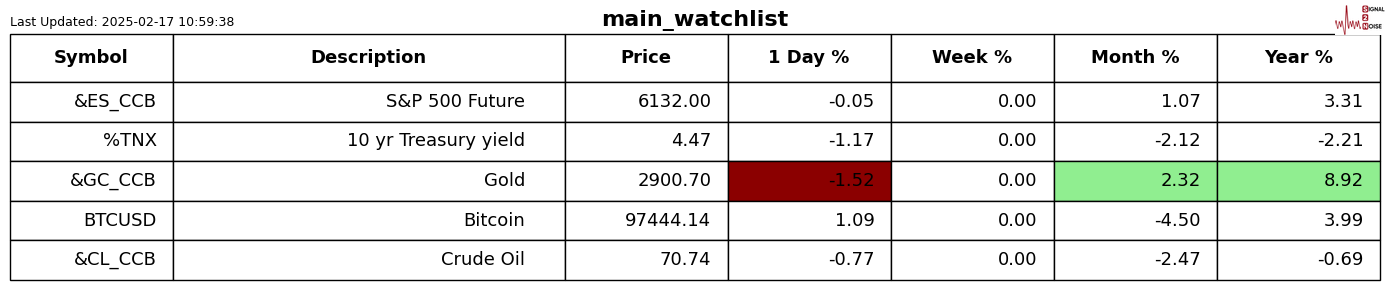
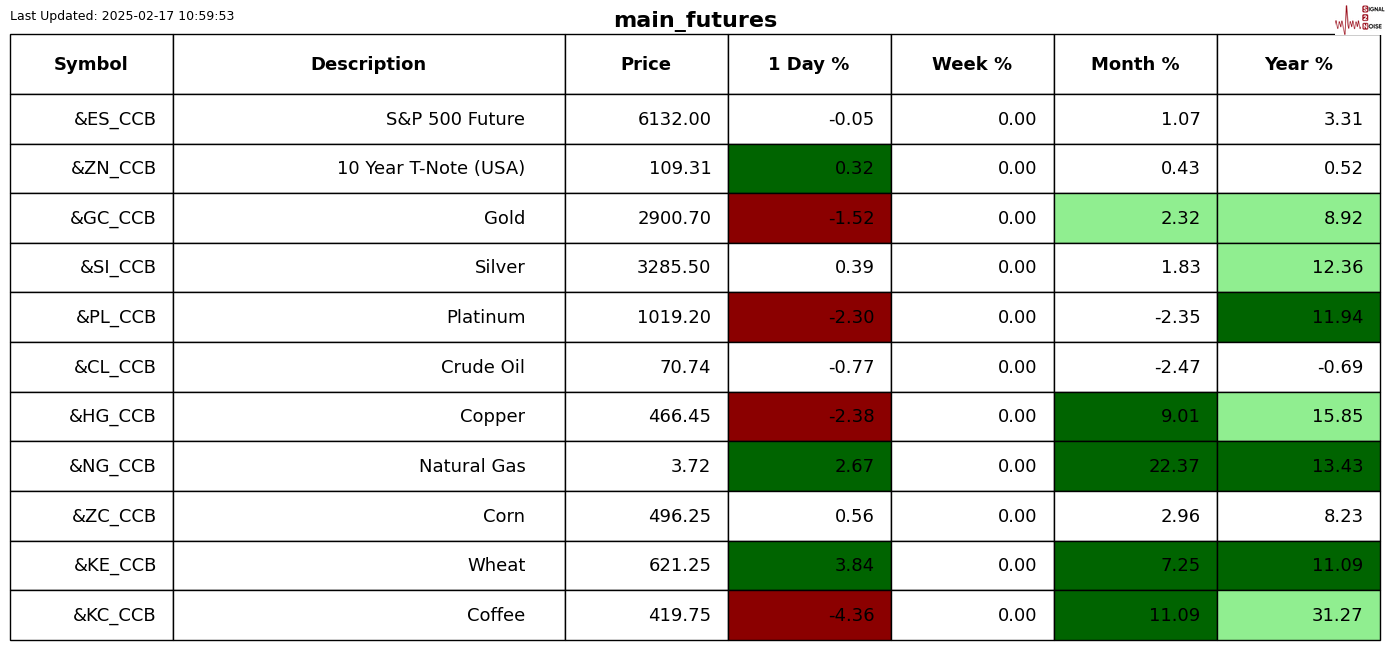
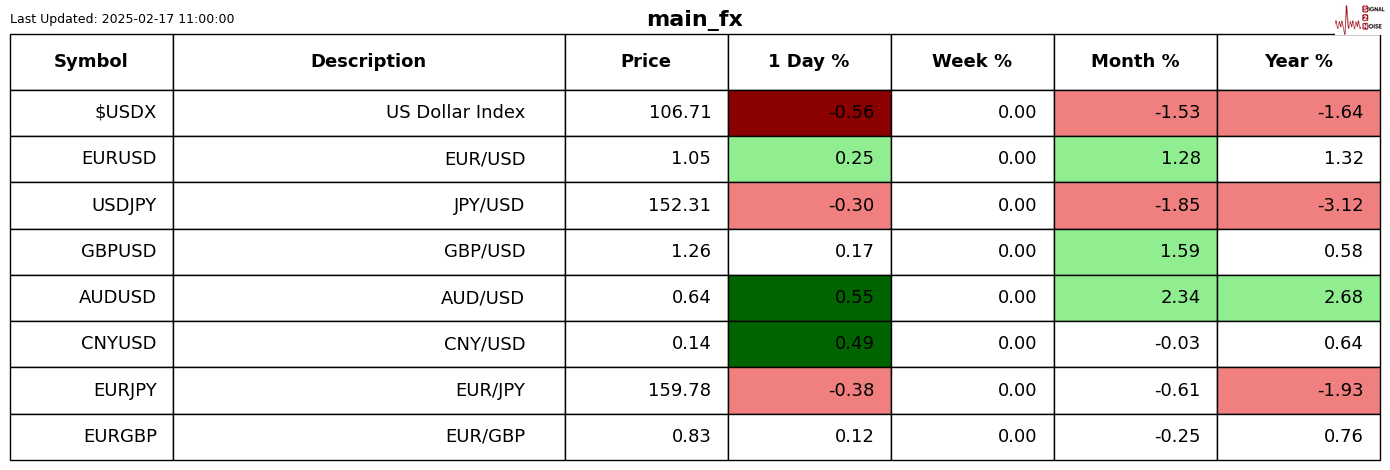
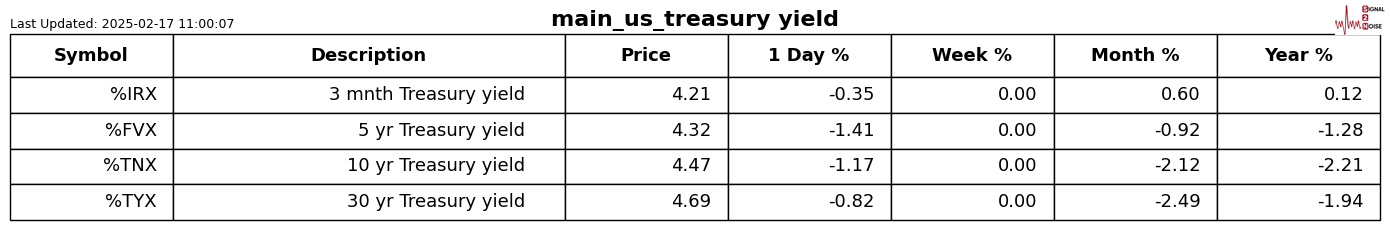
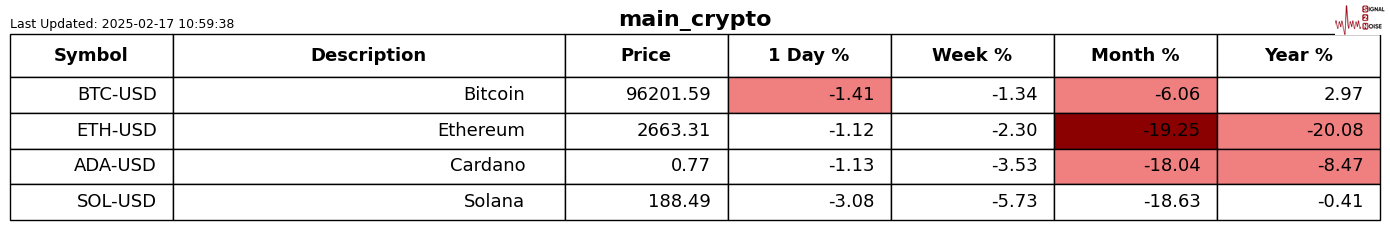
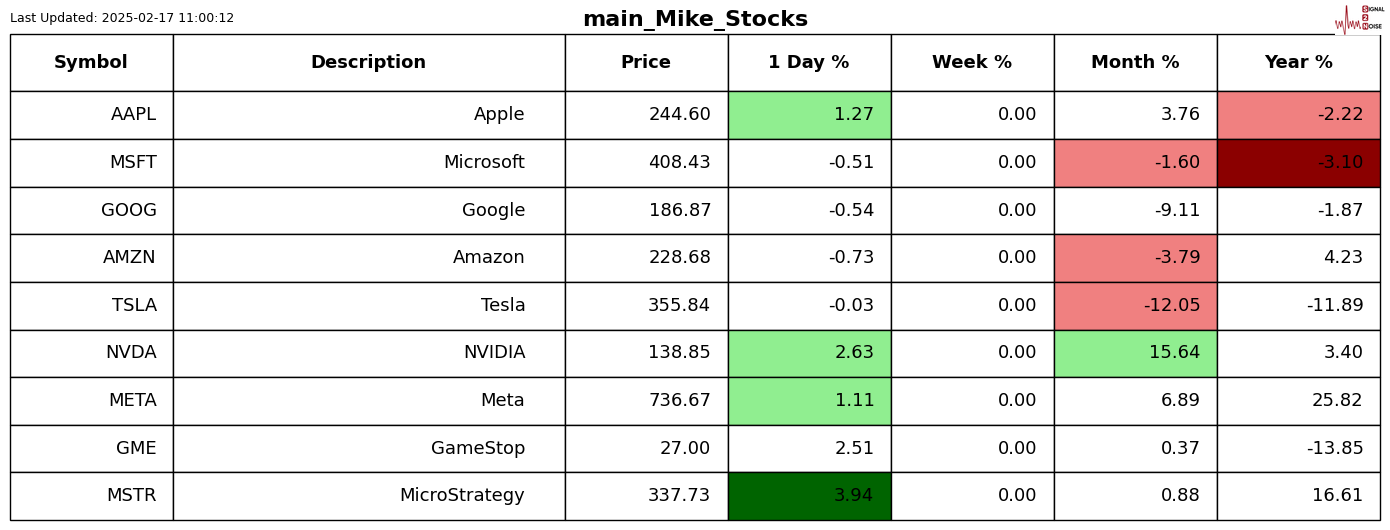
For those who are new to the letter, the shading is Z-Score adjusted so that only moves bigger than usual for the symbol are highlighted.
Chart gallery
News today


-

 Blockchain1 week ago
$8 XRP Sounds Huge—But This Analyst Isn’t Cheering Yet – Crypto News
-
Cryptocurrency1 week ago
XRP Spot ETF Update: SEC Advances WisdomTree Proposal Review – Crypto News
-

 others1 week ago
BitMEX Unveils AI-Powered VIP Trading Reports in Partnership with Hoc-trade – Crypto News
-
Business1 week ago
Bitcoin Crash Fears Escalate as BTC Price Stalls Under $110K Amid $3.2B BTC Inflow – Crypto News
-

 Blockchain7 days ago
Conduit Raises $36M to Expand Cross-Border Stablecoin System – Crypto News
-
Blockchain7 days ago
Conduit Raises $36M to Expand Cross-Border Stablecoin System – Crypto News
-

 Blockchain1 week ago
Bitcoin holds key support as HYPE, XMR, AAVE, WLD lead altcoin rally – Crypto News
-

 others1 week ago
Pound Sterling Price News and Forecast: GBP/USD surges past 1.3500 – Crypto News
-
Business1 week ago
Bitcoin 2025 Conference: List of Top Speakers & Leaders at Las Vegas Event – Crypto News
-
Technology1 week ago
Bitcoin 2025 Conference: List of Top Speakers & Leaders at Las Vegas Event – Crypto News
-

 Cryptocurrency1 week ago
Ethereum Needs to Be Resilient and Private – Crypto News
-

 Technology1 week ago
Is Apple ready to launch the AirTag 2 at WWDC 2025? Here’s what the report suggests.. – Crypto News
-

 Technology1 week ago
Malaysia and Singapore work together to improve cross-border digital trade – Crypto News
-

 Technology1 week ago
ABB Reportedly Exploring $3.5 Billion Sale of Robotics Business – Crypto News
-

 Blockchain7 days ago
XRP Marks Another Milestone As Dubai Brings $16 Billion In Real Estate Company To The Blockchain – Details – Crypto News
-
 Cryptocurrency1 week ago
XRP Price Up Again, But Here’s Why It Will Struggle to Break Above $2.50 – Crypto News
-

 Technology1 week ago
Mint Primer: Dr AI is here, but will the human touch go away? – Crypto News
-

 others1 week ago
Gold slips as Trump’s hits pause on EU duties amid thin trading volume – Crypto News
-

 Blockchain1 week ago
France’s Blockchain Group to buy 590 Bitcoin after bond sale – Crypto News
-
Business1 week ago
Solana Co-founder Raj Gokal’s Personal Info Leaked In Migos Insta Account Hack, Heres How – Crypto News
-
Business1 week ago
Breaking: Nasdaq Files 19b-4 For 21Shares Sui ETF With US SEC – Crypto News
-
Technology7 days ago
XRP News: RLUSD Stablecoin Bags New Listing on Major DeFi Platform – Crypto News
-

 Cryptocurrency7 days ago
The monetary power of the periphery: How Dallas defends the dollar – Crypto News
-

 Technology1 week ago
Apple Watch SE in 2025: Smartwatch that still makes sense for most people – Crypto News
-
others1 week ago
XRP ETF Approval Odds Rise to 83% Despite US SEC Delay – Crypto News
-
 Blockchain1 week ago
Ethereum Bullish Pattern Points To Immediate $3,000 Target – Details – Crypto News
-
Business1 week ago
Veteran Trader Predicts XRP Price Could Crash To $1.07 Next – Crypto News
-

 others1 week ago
210,140 Americans Warned As Major Data Breach Disclosed – Stolen Names, Social Security Numbers and Financial Records Identified – Crypto News
-

 Blockchain1 week ago
Bitcoin, ETH, XRP, SOL, HYPE and DOGE look ready to rally – Crypto News
-
others1 week ago
Satoshi Nakamoto Becomes 11th Richest Person As Bitcoin Holdings Surge To $120B – Crypto News
-
Business1 week ago
Sui Reveals Cause Of Cetus Hack, Commits $10M To Boost Network’s Security – Crypto News
-

 Cryptocurrency1 week ago
Bitcoin slips to $109K as short-term holders take $11.4B in profits – Crypto News
-

 Cryptocurrency1 week ago
Bitcoin slips to $109K as short-term holders take $11.4B in profits – Crypto News
-

 Cryptocurrency1 week ago
Bitcoin slips to $109K as short-term holders take $11.4B in profits – Crypto News
-

 Blockchain1 week ago
Block to Enable Merchants to Accept Bitcoin Payments – Crypto News
-
others1 week ago
Symmetrical Triangle Chart Pattern Hints 20% Pi Coin Price Rally – Crypto News
-
Business1 week ago
Symmetrical Triangle Chart Pattern Hints 20% Pi Coin Price Rally – Crypto News
-
Technology1 week ago
Breaking: Telegram Partners with Elon Musks’s xAI, TON Price Jumps 23% – Crypto News
-

 Cryptocurrency7 days ago
XRP drops 1.05% as resistance levels cap recovery – Crypto News
-

 Cryptocurrency6 days ago
Nifty 50 Ends Higher After Two-Day Drop, But Bulls Struggle to Break 25,000 – Crypto News
-

 others6 days ago
Gold surges above $3,300 as US jobs data disappoints, Trump tariffs blocked – Crypto News
-

 Technology5 days ago
Cool savings for a hot season: Top 10 deals for you on ACs, refrigerators, microwaves, and more with up to 60% off – Crypto News
-

 Cryptocurrency4 days ago
One day left to invest in Bitcoin Pepe before it hits centralised exchanges – Crypto News
-

 Technology4 days ago
WhatsApp Status gets new Instagram-like features: Here’s what’s new – Crypto News
-
Technology1 week ago
Veteran Trader Predicts XRP Price Could Crash To $1.07 Next – Crypto News
-
Business1 week ago
Why is Bitcoin Struggling to Break $110K? – Crypto News
-

 Cryptocurrency1 week ago
Bitcoin Pizza Day showcases the utility of crypto – Crypto News
-

 Technology1 week ago
After string of outages, Elon Musk says he’s returning to 24/7 grind to fix X: ‘Will sleep in server rooms’ – Crypto News
-
Business1 week ago
Bitcoin 2025 Conference: List of Top Speakers & Leaders at Las Vegas Event – Crypto News
-

 others1 week ago
Morgan Stanley Warns Big Drop for US Dollar Incoming As Bank Updates Market Forecast – Crypto News