


others
NIKKEI ( $NKD_F ) Buying The Dips At The Blue Box Area – Crypto News
In this article we’re going to take a quick look at the Elliott Wave charts of NIKKEI published in members area of the website. As our members know NIKKEI is showing impulsive bullish sequences that are calling for a further strength. Recently we got a 3 waves pull back that has ended right at the Blue Box zone (our buying area). In the further text we are going to explain the Elliott Wave forecast and trading setup.
NIKKEI Elliott Wave 4 Hour Chart 07.11.2022
NIKKEI is giving us pull back in 3 waves that are reaching extreme area at 32150-31082 blue box (buying zone). We don’t recommend selling the futures and prefer the long side. NIKKEI should ideally make a rally towards new highs or 3 waves bounce alternatively. As our members know Blue boxes are based on 100% – 161.8% Fibonacci extension area, that we trade in 3, 7, or 11 swing corrective sequence. Once bounce reaches 50 Fibs against the B red high, we will make long position risk free (put SL at BE) and take partial profits. Invalidation for the long trades is break of 1.618 fib ext : 31082
Official trading strategy on How to trade 3, 7, or 11 swing and equal leg is explained in details in Educational Video, available for members viewing inside the membership area. Quick reminder on how to trade our charts :
Red bearish stamp+ blue box = Selling Setup
Green bullish stamp + blue box = Buying Setup
Charts with Black stamps are not tradable.
NIKKEI Elliott Wave 4 Hour Chart 07.19.2022
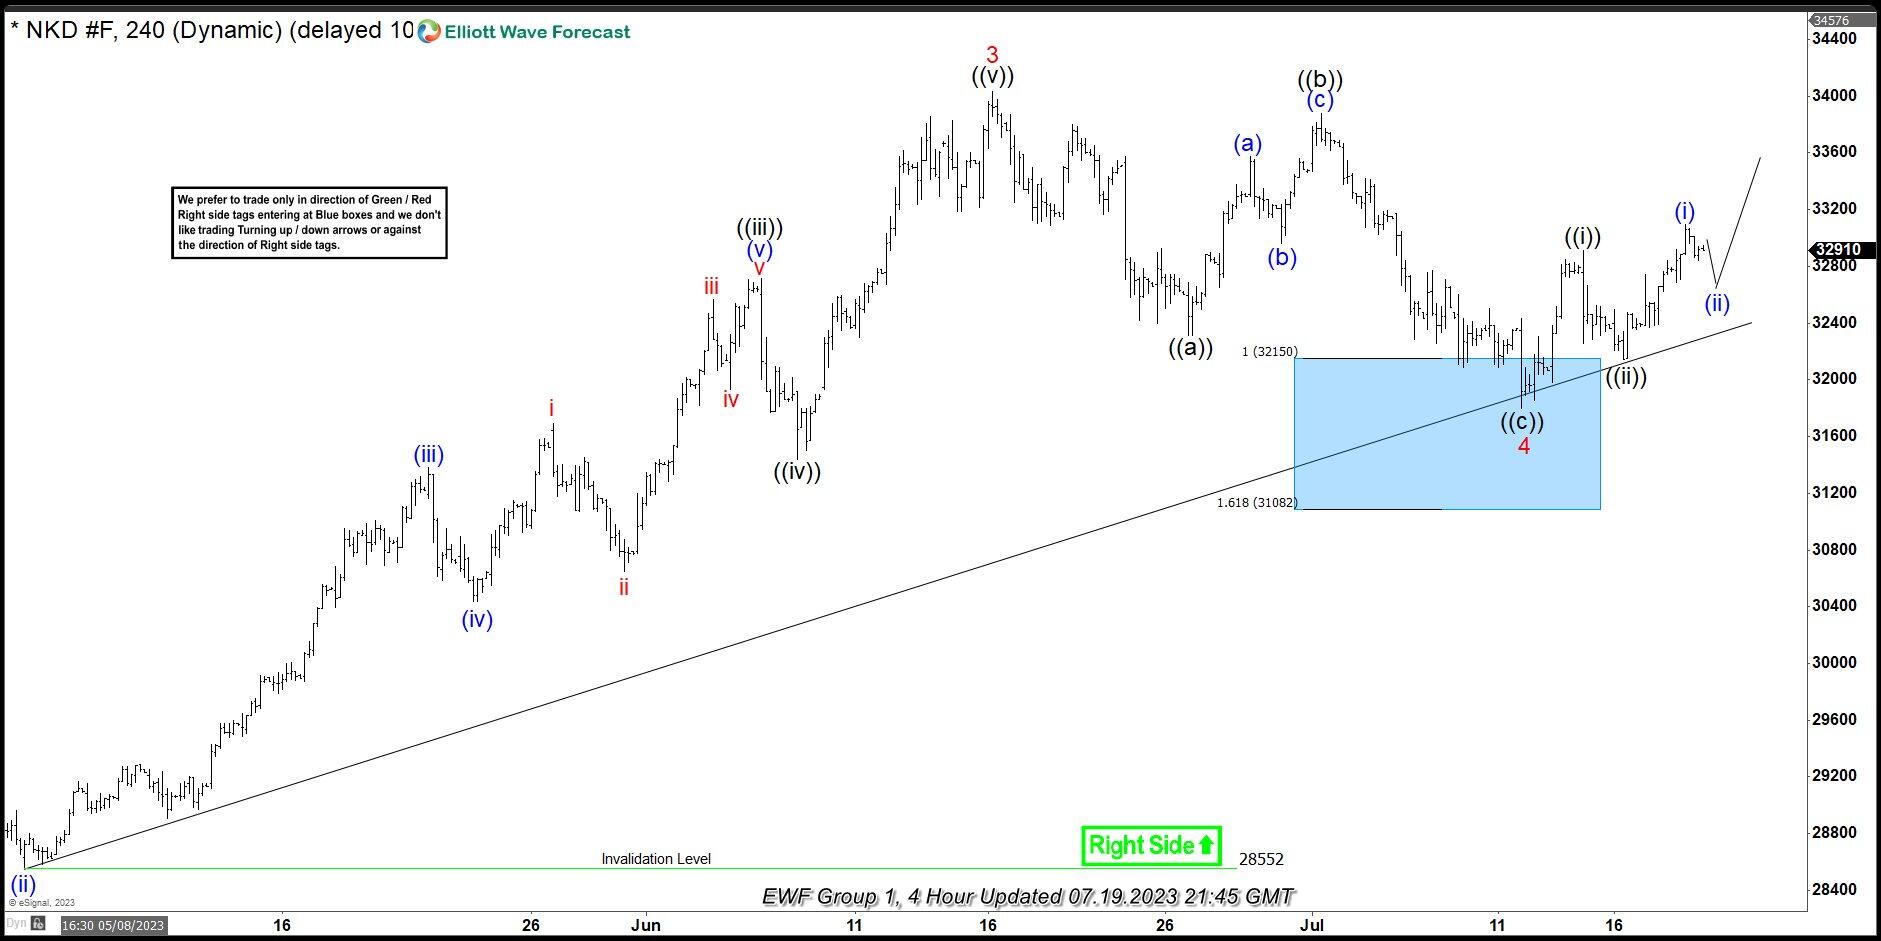
NIKKEI made good response from our buying zone. We call wave 4 red completed at 31811 low. The price has reached and exceeded 50 fibs against the ((b)) black high. Members who took the long trade are enjoying profits now in a risk free positions. We would like to see break of 3 red high, to confirm next leg up is in progress.
Keep in mind that market is dynamic and presented view could have changed in the mean time.


-

 Blockchain24 hours ago
On-Chain Tokenization for Payments Professionals – Crypto News
-
Cryptocurrency6 days ago
Pi Community Highlights Pi Coin’s Slow Growth As ‘Strategic’ – Crypto News
-

 Cryptocurrency1 week ago
Professor Coin: What’s Driving Cryptocurrency Adoption Around the World – Crypto News
-

 Blockchain1 week ago
CZ claps back against ‘baseless’ US plea deal allegations – Crypto News
-

 Technology1 week ago
Apple ramps up India production amid China uncertainty, assembles $22 billion worth iPhones in a year – Crypto News
-
Business5 days ago
Cardano (ADA) and Dogecoin (DOGE) Eye For Bullish Recovery – Crypto News
-

 Business5 days ago
Worldpay and FIS Deals Echo 2019’s Payments Megamergers – Crypto News
-
![Shiba Inu [SHIB] price prediction - A 70% rally next after 900%+ burn rate hike?](https://dripp.zone/news/wp-content/uploads/2025/04/Shiba-Inu-SHIB-price-prediction-A-70-rally-next-400x240.png)
![Shiba Inu [SHIB] price prediction - A 70% rally next after 900%+ burn rate hike?](https://dripp.zone/news/wp-content/uploads/2025/04/Shiba-Inu-SHIB-price-prediction-A-70-rally-next-80x80.png) Cryptocurrency1 week ago
Cryptocurrency1 week agoShiba Inu [SHIB] price prediction – A 70% rally next after 900%+ burn rate hike? – Crypto News
-

 others1 week ago
Gold consolidates near all-time peak as bulls pause for breather – Crypto News
-

 Cryptocurrency7 days ago
White House Mulls Bitcoin Reserve Backed by Gold and Tariffs – Crypto News
-

 Cryptocurrency6 days ago
OKX Returns to US Market Following $505M DOJ Deal – Crypto News
-

 Blockchain5 days ago
Solana Turns Bullish On 8H Chart – Break Above $147 Could Confirm New Trend – Crypto News
-
Technology4 days ago
Expert Predicts Pi Network Price Volatility After Shady Activity On Banxa – Crypto News
-
 Blockchain1 week ago
XRP Price To Hit $45? Here’s What Happens If It Mimics 2017 And 2021 Rallies – Crypto News
-

 others1 week ago
Ripple Community Remains Disappointed With Hinman Report, What’s Next? – Crypto News
-

 Metaverse1 week ago
Forget DeepSeek. Large language models are getting cheaper still – Crypto News
-

 others1 week ago
Crypto Strategist Sees Solana-Based Memecoin Surging Higher, Says One AI Altcoin Flashing Strong Chart – Crypto News
-

 Cryptocurrency1 week ago
Pepe is on the verge breakout to $0.0000078 as gold cross nears. – Crypto News
-

 Blockchain5 days ago
Bitcoin online chatter flips bullish as price chops at $85K: Santiment – Crypto News
-

 Cryptocurrency5 days ago
Judge Pauses 18-State Lawsuit Against SEC, Saying It Could ‘Potentially Be Resolved’ – Crypto News
-
Business5 days ago
Coinbase Reveals Efforts To Make Its Solana Infrastructure Faster, Here’s All – Crypto News
-

 Cryptocurrency1 week ago
Bitcoin – Here’s what’s next after sellers near exhaustion levels – Crypto News
-

 others1 week ago
On-Chain Indicator Suggests Ethereum (ETH) Could Be Undervalued, According to Crypto Analyst – Crypto News
-

 others1 week ago
Mexican Peso ends week strong as USD plunges on China tariff retaliation – Crypto News
-

 Blockchain1 week ago
On-Chain Clues Suggest Bitcoin Bounce Might Be a False Signal—Here’s What to Know – Crypto News
-

 others1 week ago
China’s Copper imports drop – ING – Crypto News
-

 Cryptocurrency6 days ago
A decade in, Liberland needs the Bitcoin standard more than ever – Crypto News
-

 Technology6 days ago
India, Australia explore bilateral data-sharing treaty to tackle cybercrime – Crypto News
-

 Technology5 days ago
Moto Book 60 laptop, Pad 60 Pro launched in India: Price, features, battery and more – Crypto News
-

 others5 days ago
UnitedHealth stock caves 23% as it cuts full-year guidance – Crypto News
-
Technology5 days ago
Coinbase Reveals Efforts To Make Its Solana Infrastructure Faster, Here’s All – Crypto News
-
others5 days ago
Coinbase Reveals Efforts To Make Its Solana Infrastructure Faster, Here’s All – Crypto News
-
others5 days ago
How High Should Dogecoin Price Rise to Turn $10K to $100K? – Crypto News
-

 Technology1 week ago
Price drop on 43 inch TVs: Grab the best deals on Samsung, Sony, Xiaomi and more, up to 57% off – Crypto News
-
 Technology1 week ago
3 Altcoins to Buy as US Senate Banking Chair Gives August Deadline For Major Crypto Bills – Crypto News
-

 Blockchain1 week ago
Boosting Ethereum: Bankless Cofounder Lays Out New Vision For Price Surge – Crypto News
-
![Bearish sequence in Nifty favors downside [Video]](https://dripp.zone/news/wp-content/uploads/2025/02/Bearish-sequence-in-Nifty-favors-downside-Video-Crypto-News-400x240.png)
![Bearish sequence in Nifty favors downside [Video]](https://dripp.zone/news/wp-content/uploads/2025/02/Bearish-sequence-in-Nifty-favors-downside-Video-Crypto-News-80x80.png) others1 week ago
others1 week agoDow Jones recovers ground to post one of its best weeks in years – Crypto News
-

 Cryptocurrency1 week ago
Scottish School Will Accept Bitcoin Payments, May Launch BTC Reserve – Crypto News
-

 Blockchain1 week ago
‘Bitcoin Standard’ author to develop Austrian economics curriculum for UK school – Crypto News
-

 Business1 week ago
Michael Saylor Hints At Another MicroStrategy Bitcoin Purchase, BTC Price To Rally? – Crypto News
-
 others1 week ago
Mantra Team Responds As The OM Token Price Crashes Over 80% In 24 Hours – Crypto News
-

 others1 week ago
USD/CAD falls toward 1.3850 due to potential US recession, persistent inflation – Crypto News
-

 Blockchain1 week ago
Crypto markets ‘relatively orderly’ despite Trump tariff chaos: NYDIG – Crypto News
-

 others6 days ago
President Trump Planning Launch of New Monopoly-Inspired Crypto Game: Report – Crypto News
-

 Blockchain6 days ago
Stablecoins’ dominance due to limitations of US banking — Jerald David – Crypto News
-

 Cryptocurrency6 days ago
SOL remains bullish amid broader market stagnation – Crypto News
-

 Technology5 days ago
Spotify down: Music streaming giant leaves thousands of users affected globally – Crypto News
-
Business5 days ago
Crypto Whales Bag $20M In AAVE & UNI, Are DeFi Tokens Eyeing Price Rally? – Crypto News
-

 Blockchain5 days ago
Jio partnership to drive real-world Web3 adoption for 450M users – Crypto News
-

 Metaverse5 days ago
Le Chat, the cat-bot France has pinned its AI hopes on – Crypto News