


others
NIO dragged down by poor Tesla earnings – Crypto News
- Nio stock is falling behind similar EV stocks in 2023.
- Deliveries fell YoY both in June and in Q2.
- Nio shared in the fallout of weak Tesla earnings late Wednesday.
Nio (NIO) The stock dropped over 2.0% after the opening bell on Thursday after feeling the ripple effects of Tesla’s (TSLA) second quarter earnings release in which it was revealed the company had missed its gross margin consensus estimates, late Wednesday.
Nio is still lagging behind the electric vehicle (EV) pack as the stock market nears the end of July. Among a handful of young EV stocks that grew in popularity in 2021 and 2022, NIO stock is one of the worst performers in 2023.
A major reason for this loss of investor interest is the drop off in demand for Nio’s models compared with its counterparts. Nio witnessed falling deliveries in both June and the second quarter, while most other competitors experienced YoY growth.
The NASDAQ also fell 0.45% at Thursday’s open.
Nio stock news: Tesla drops after margin compression
Nio’s stock price pulled back 1% in Thursday’s premarket following Tesla’s second-quarter results late Wednesday. The EV leader beat Wall Street forecasts for revenue and earnings, but its stock price dropped more than 4% on slimmed-down gross margins.
Tesla spent much of the winter and spring quite publicly cutting prices across its range of models, and the sizable 10% gain in QoQ deliveries at these lower prices has predictably cut into margins.
Tesla reported an automotive gross margin of 18.2% in the second quarter, which failed to meet analyst consensus of 18.8%. Back in the early part of the year, Tesla Chief Financial Officer Zach Kirkhorn pledged that Tesla would not drop below a 20% gross margin, but here we are. As recently as the fourth quarter of 2022, the gross margin was 24%.
This relates to Nio, because the Chinese competitor bears a gross margin of just 1.5%. Low gross margins are somewhat normal when developing a company in a high capex industry like automobiles, but if the EV leader is pushing margins down, that might create more income statement pressure for upstarts like Nio.
To make matters worse, Nio hasn’t been seeing the growth needed to boost its gross margin. The Shanghai-based automaker delivered just 10,707 vehicles in June compared to 12,961 in June 2022. That amounts to a 17.4% pullback YoY.
And it wasn’t only June. For the second quarter, Nio delivered 23,520 vehicles – a 6.1% decline from Q2 2022.
That poor showing cannot be blamed on the lagging Chinese economy either. Overall automobile sales rose 4.9% YoY in June, while New Energy Vehicles sales (or NEVs, which includes Nio) rose 35%. Nio has clearly become a laggard among its competitors.
Nio stock forecast: No love for Nio
As the year-to-date chart below shows, Nio stock is the second-worst performing EV stock when compared to Li Auto (LI), XPeng (XPEV), Rivian (RIVN), Lucid (LCID) and Polestar (PSNY), Nio is up 10.5% YTD, while Li Auto stock leads the pack with a 78.4% gain. XPeng and Rivian stocks have advanced 47.2% and 43.2%, respectively. Even Lucid has gained 17.5% YTD despite its decision to raise new equity.
Of these six stocks, Nio only leads Polestar (-13.9% YTD) at this point in the year despite the fact that both Rivian and XPeng underperformed it earlier in the year.
NIO stock YTD compared to LI, XPEV, RIVN, LCID, PSNY
The daily chart does give investors some reason for hope though. First, Nio stock has overcome the range high since late March. Following an abrupt pullback last week, it looks rather likely that bulls will attempt to retest the range high from January at $13.22. NIO stock experienced a double-top at that price level last time around.
Additionally, the Relative Strength Index (RSI) is not yet overbought as it is with a number of other competitors that have experienced swifter price rallies this summer. The 9-day Simple Moving Average (SMA) has also been leading its 21-day SMA counterpart by a wide margin. It might just take longer for Nio stock bulls to reach the $13 to $14 resistance zone as shares get accumulated at a more gingerly pace.
Medium-term support remains at $9.50.
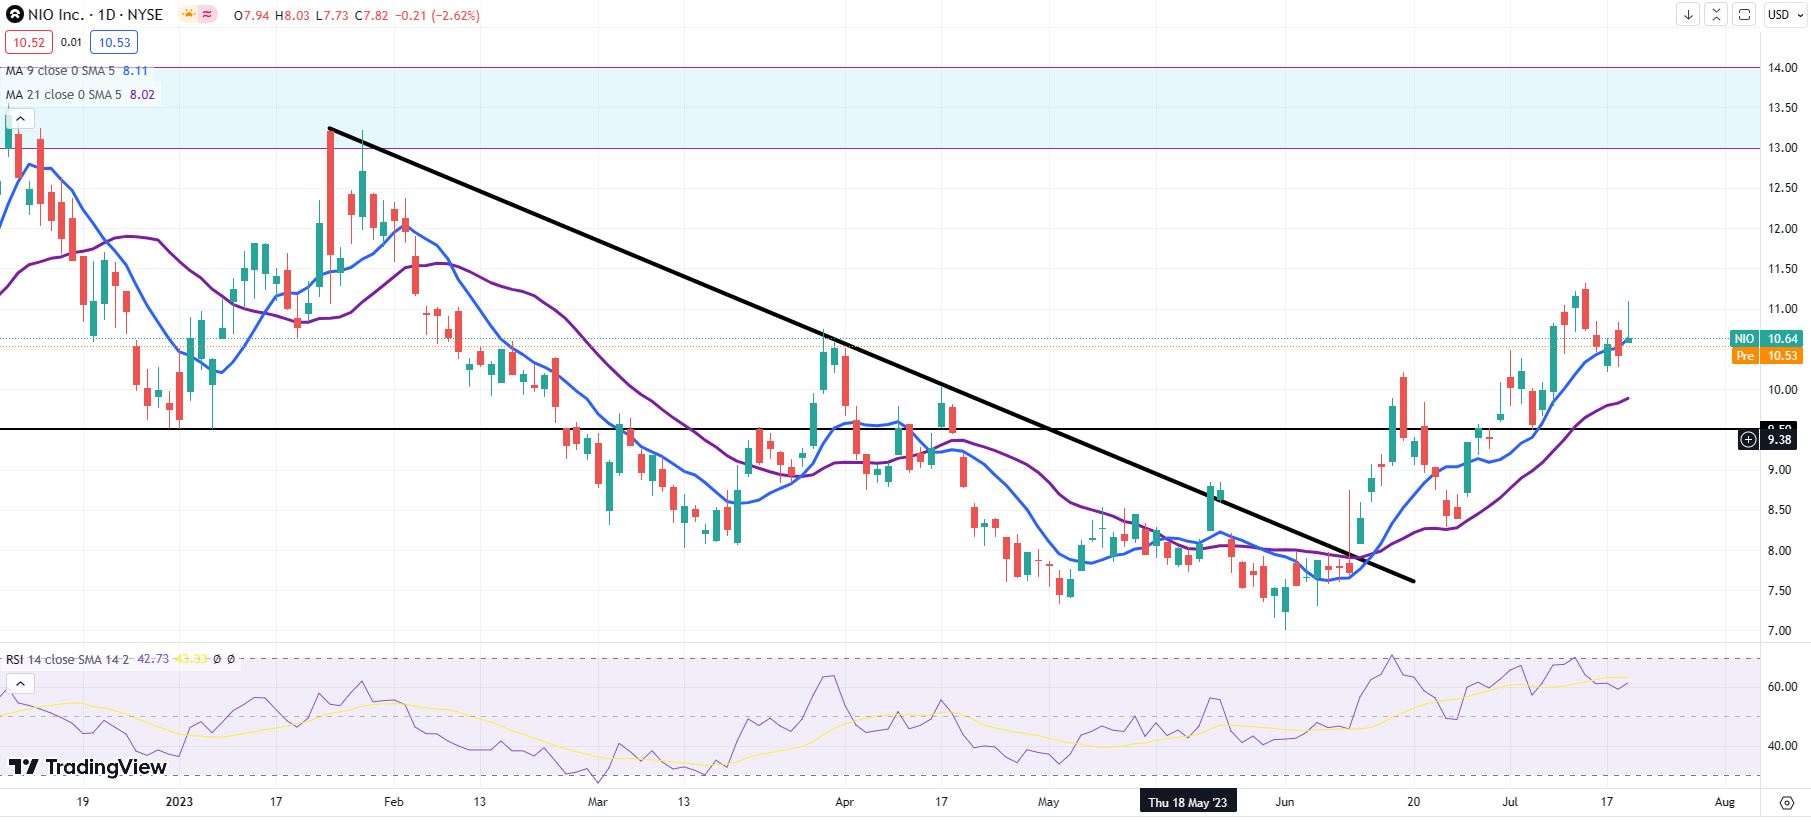
nio daily chart
NASDAQ FAQs
The Nasdaq is a stock exchange based in the US that started out life as an electronic stock quotation machine. At first, the Nasdaq only provided quotations for over-the-counter (OTC) stocks but later it became an exchange too. By 1991, the Nasdaq had grown to account for 46% of the entire US securities’ market. In 1998, it became the first stock exchange in the US to provide online trading. The Nasdaq also produces several indices, the most comprehensive of which is the Nasdaq Composite representing all 2,500-plus stocks on the Nasdaq, and the Nasdaq 100.
The Nasdaq 100 is a large-cap index made up of 100 non-financial companies from the Nasdaq stock exchange. Although it only includes a fraction of the thousands of stocks in the Nasdaq, it accounts for over 90% of the movement. The influence of each company on the index is market-cap weighted. The Nasdaq 100 includes companies with a significant focus on technology although it also encompasses companies from other industries and from outside the US. The average annual return of the Nasdaq 100 has been 17.23% since 1986.
There are a number of ways to trade the Nasdaq 100. Most retail brokers and spread betting platforms offer bets using Contracts for Difference (CFD). For longer-term investors, Exchange-Traded Funds (ETFs) trade like shares that mimic the movement of the index without the investor needing to buy all 100 constituent companies. An example ETF is the Invesco QQQ Trust (QQQ). Nasdaq 100 futures contracts allow traders to speculate on the future direction of the index. Options provide the right, but not the obligation, to buy or sell the Nasdaq 100 at a specific price (strike price) in the future.
Many different factors drive the Nasdaq 100 but primarily it is the aggregate performance of the component companies revealed in their quarterly and annual company earnings reports. US and global macroeconomic data also contributes as it impacts on investor sentiment, which if positive drives gains. The level of interest rates, set by the Federal Reserve (Fed), also influences the Nasdaq 100 as it affects the cost of credit, on which many corporations are heavily reliant. As such the level of inflation can be a major driver too as well as other metrics which impact on the decisions of the Fed.


-
others1 week ago
Will Ethereum Price Rally to $3,200 as Wall Street Pivots from BTC to ETH – Crypto News
-
![DIS Elliott Wave technical analysis [Video]](https://dripp.zone/news/wp-content/uploads/2025/06/DIS-Elliott-Wave-technical-analysis-Video-Crypto-News-400x240.jpg)
![DIS Elliott Wave technical analysis [Video]](https://dripp.zone/news/wp-content/uploads/2025/06/DIS-Elliott-Wave-technical-analysis-Video-Crypto-News-80x80.jpg) others1 week ago
others1 week agoSkies are clearing for Delta as stock soars 13% on earnings beat – Crypto News
-
others1 week ago
Skies are clearing for Delta as stock soars 13% on earnings beat – Crypto News
-

 Blockchain1 week ago
Insomnia Labs Debuts Stablecoin Credit Platform for Creators – Crypto News
-

 Blockchain1 week ago
Ant Group Eyes USDC Integration Circle’s: Report – Crypto News
-

 Cryptocurrency1 week ago
Tornado Cash Judge Won’t Let One Case Be Mentioned in Roman Storm’s Trial: Here’s Why – Crypto News
-

 Blockchain1 week ago
XRP Rally Possible If Senate Web3 Crypto Summit Goes Well – Crypto News
-

 others1 week ago
USD/CAD trades with positive bias below 1.3700; looks to FOMC minutes for fresh impetus – Crypto News
-
 Blockchain1 week ago
Kraken and Backed Expand Tokenized Equities to BNB Chain – Crypto News
-

 others1 week ago
EUR/GBP posts modest gain above 0.8600 ahead of German inflation data – Crypto News
-

 Cryptocurrency1 week ago
Bitcoin Breaks New Record at $111K, What’s Fueling the $120K Price Target? – Crypto News
-
Technology1 week ago
XRP Eyes $3 Breakout Amid Rising BlackRock ETF Speculation – Crypto News
-
Business7 days ago
PENGU Rallies Over 20% Amid Coinbase’s Pudgy Penguins PFP Frenzy – Crypto News
-

 Blockchain5 days ago
Robinhood Dealing With Fallout of Tokenized Equities Offering – Crypto News
-

 Cryptocurrency4 days ago
Whale Sells $407K TRUMP, Loses $1.37M in Exit – Crypto News
-
Technology1 week ago
Solana Meme Coin PNUT Rallies 10% Amid Elon Musk’s Statement – Crypto News
-
 Cryptocurrency1 week ago
Is ETH Finally Ready to Shoot For $3K? (Ethereum Price Analysis) – Crypto News
-

 Blockchain1 week ago
Binance Founder Backs BNB Treasury Company Aiming For US IPO – Crypto News
-

 Blockchain1 week ago
Ethereum Bulls Roar — $3K Beckons After 5% Spike – Crypto News
-
Business1 week ago
Did Ripple Really Win XRP Lawsuit Despite $125M Fine? Lawyer Fires Back at CEO – Crypto News
-

 Cryptocurrency1 week ago
XRP price forecast as coins surges 2.19% to $2.33 – Crypto News
-

 Technology1 week ago
Perplexity launches Comet, an AI-powered browser to challenge Google Chrome; OpenAI expected to enter the space soon – Crypto News
-

 Blockchain1 week ago
SUI Chart Pattern Confirmation Sets $3.89 Price Target – Crypto News
-
Technology1 week ago
Breaking: SharpLink Purchases 10,000 ETH from Ethereum Foundation, SBET Stock Up 7% – Crypto News
-

 others7 days ago
EUR/GBP climbs as weak UK data fuels BoE rate cut speculation – Crypto News
-

 Blockchain7 days ago
Bitcoin Hits All-Time High as Crypto Legislation Votes Near – Crypto News
-
Technology1 week ago
GameSquare Stock Shoots 58% After Revealing $100 Million Ethereum Treasury Strategy – Crypto News
-

 others1 week ago
Australian Dollar remains stronger due to persistent inflation risks, FOMC Minutes eyed – Crypto News
-

 others1 week ago
US Dollar Resurgence May Be Around the Corner, According to Barclays Currency Strategist – Here’s Why: Report – Crypto News
-
others1 week ago
Trump Jr. Backed Thumzup Media To Invest In ETH, XRP, SOL, DOGE And LTC – Crypto News
-

 Cryptocurrency1 week ago
Bitcoin Hits Record Peak. How High Can It Surge in 2025? – Crypto News
-
Technology1 week ago
VC Firm Ego Death Capital Closes $100M Funding to Back Bitcoin-Based Projects – Crypto News
-
Cryptocurrency1 week ago
Tokenized Securities Are Still Securities, US SEC Warns Robinhood, Kraken – Crypto News
-

 others1 week ago
NovaEx Launches with a Security-First Crypto Trading Platform Offering Deep Liquidity and Institutional-Grade Infrastructure – Crypto News
-

 Blockchain1 week ago
Australia Banks Join Digital Currency Trial for Tokenized Assets – Crypto News
-

 Metaverse1 week ago
How Brands Can Deepen Customer Connections in the Metaverse – Crypto News
-

 others1 week ago
Anthony Scaramucci Says $180,000 Bitcoin Price Explosion Possible As BTC ‘Supremacy’ Creeps Up – Here’s His Timeline – Crypto News
-
Cryptocurrency1 week ago
Bitcoin Breaks New Record at $111K, What’s Fueling the $120K Price Target? – Crypto News
-
Business1 week ago
US Senate To Release CLARITY Act Draft Next Week – Crypto News
-

 others1 week ago
$687,220,000 in Bitcoin Shorts Liquidated in Just One Hour As BTC Explodes To $116,000 – Crypto News
-

 Business7 days ago
S&P Global Downgrades Saks Global’s Credit Rating – Crypto News
-

 Cryptocurrency4 days ago
Satoshi-Era Bitcoin Whale Moves Another $2.42 Billion, What’s Happening? – Crypto News
-

 Technology1 week ago
Google’s worst nightmare? OpenAI’s new AI web browser is coming soon to challenge Chrome – Crypto News
-

 Technology1 week ago
10 Smartchoice tablets from top brands, curated for everyday use, up to 45% off before Amazon Prime Day Sale – Crypto News
-
others1 week ago
China’s Ant Group With 1.4B Users Taps Circle to Integrate USDC – Crypto News
-

 Blockchain5 days ago
Ziglu Faces $2.7M Shortfall as Crypto Fintech Enters Special Administration – Crypto News
-

 Cryptocurrency1 week ago
Bitcoin crash narrative returns as geopolitical tensions mount – Crypto News
-

 Cryptocurrency1 week ago
Ethereum ascends: Institutional pivot and dormant whale moves signal a new era – Crypto News
-
Business1 week ago
XRP Open Interest Skyrockets Ahead Of ProShares XRP ETF Approval – Crypto News
-

 Blockchain1 week ago
Analyst Predicts 50% “Moonshot” For XRP Price If This Line Breaks – Crypto News