


Business
Terra Classic Price Prediction As Bull Run Erupts, Can LUNC Crack $0.00016? – Crypto News
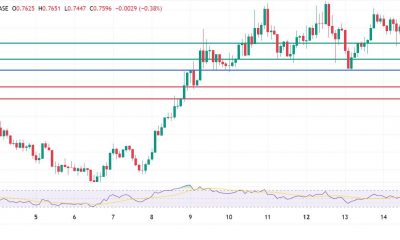
Terra Classic price inverse head and shoulders pattern breakout snarls up at $0.0001374 but with a successful retest of the neckline S/R, LUNC can potentially hit $0.00016.
<!–

–>
Published 5 seconds ago
Altcoins including Terra Classic rallied the most backed by the hype that followed the approval of spot Bitcoin exchange-traded funds (ETFs) for the first time in the US. While Bitcoin also rose touching $49,000 at one point, its reaction to the news was more or less lethargic.
This lack of momentum in Bitcoin price continues to hurt the market, especially altcoins.
Although Terra Classic climbed back to early January levels at $0.0001374, it lacked the momentum to keep the uptrend sustained. Instead, the token has retraced to trade at $0.0001297 and tested a very important bullish pattern support.
Terra Classic Price on the Threshold of 30% Move
The rise to $0.0001374 can be attributed to a commendable breakout from a recently formed inverse head and shoulders pattern. This bullish pattern often forms toward the end of a correction, signaling a potential trend change.
Trading patterns can be extremely challenging for new traders but also experienced investors. Therefore knowing when to enter a long or short position is the secret to staying profitable. Technical indicators often come in handy to help guide trading decisions.
The importance of an inverse head and shoulders starts to materialize after the asset breaks above the neckline resistance. In Terra Classic’s case, this hurdle lies at $0.000129.
Long positions will be entered above the neckline, anticipating a breakout equal to the height of the pattern — 30% for LUNC as shown on the chart. Increasing trading volumes help to sustain the breakout, due to resistance at the 200 Exponential Moving Average (EMA) (in purple) at $0.0001374.
Terra Classic (LUNC) bulls received a boost on January 8 when the Moving Average Convergence Divergence (MACD) indicator flashed a buy signal. This technical cue reinforces the positive sentiment surrounding the token. Adding to the bullish case, a potential moving average crossover on the four-hour chart could further fuel optimism. As of now, the blue 20 EMA line is approaching a close above the red 50 EMA, painting a promising picture for LUNC in the coming days.
Despite the retracement from the weekly high, opportunities in LUNC are in plenty. For this reason, traders should be alert for a potential rebound from the neckline. This would serve as confirmation for the uptrend and an eventual breakout first to $0.00016 (triangle target) and above $0.0002 over the coming weeks.
Related Articles
The presented content may include the personal opinion of the author and is subject to market condition. Do your market research before investing in cryptocurrencies. The author or the publication does not hold any responsibility for your personal financial loss.
<!– Close Story–>
-

 Business1 week ago
How Mid-Sized Treasurers Are Managing Liquidity Amid Uncertainty – Crypto News
-

 others3 days ago
USD/CAD trades with negative bias around mid-1.3800s, just above two-week low – Crypto News
-

 De-fi3 days ago
Bitcoin Hits $109,439 Ahead of 15th Anniversary of Laszlo Hanyecz’s 10,000 BTC Pizza Purchase – Crypto News
-
others1 week ago
Kekius Maximus Token Jumps 119% as Elon Musk Changes X Profile – Crypto News
-

 De-fi3 days ago
Bitcoin Hits $109,439 Ahead of 15th Anniversary of Laszlo Hanyecz’s 10,000 BTC Pizza Purchase – Crypto News
-

 Technology3 days ago
Build your own PC with up to 60% off on CPUs, GPUs, and more: No cost EMI starting at ₹99 – Crypto News
-
Business3 days ago
XRP ETF Odds Surge Amid CME Futures Growth: Can Approval Happen by June 17? – Crypto News
-

 Blockchain1 week ago
Stablecoin bill passes in Northern Marianas as House overrides veto – Crypto News
-

 Blockchain1 week ago
Solana Poised For Upside Move After A Bounce From $168 – Crypto News
-

 Cryptocurrency1 week ago
Top crypto to buy as Saudi Central Bank reveals exposure to MSTR – Crypto News
-

 Technology1 week ago
Infinix Note 50s 5G Review: Most balanced phone under ₹20,000 – Crypto News
-
Technology1 week ago
XRP Price Impact If GENIUS Act Boosts Ripple’s RLUSD Market Cap to 50% of Tether’s $150B – Crypto News
-
others3 days ago
Shiba Inu Price Surges as Whales Buy 530 Trillion SHIB – Breakout Imminent? – Crypto News
-

 Blockchain1 day ago
Why Equity Markets Are Being Tokenized – Crypto News
-

 others1 week ago
Crypto Trader Prints 517x Profit on Solana-Based Altcoin That’s Exploded 7,000% in Just One Week: Lookonchain – Crypto News
-
others1 week ago
Dogecoin On-Chain Metrics Hint At DOGE Mega Rally Ahead – Crypto News
-

 Blockchain1 week ago
90% of institutions ‘taking action’ on stablecoins: Fireblocks survey – Crypto News
-
Business1 week ago
XRP Futures ETF Goes Live on May 19: Will It Beat ETH And BTC Debut? – Crypto News
-
others1 week ago
XRP Futures ETF Goes Live on May 19: Will It Beat ETH And BTC Debut? – Crypto News
-

 others1 week ago
US Senators Make Potential Progress on Stablecoin Bill Amid Partisan Negotiations: Report – Crypto News
-

 De-fi1 week ago
President Trump Urges U.S. to Engage with Bitcoin as Wall Street and Trillion-Dollar Firms Show Interest – Crypto News
-

 Blockchain1 week ago
Bitfinex Bitcoin longs total $6.8B while shorts stand at $25M — Time for BTC to rally? – Crypto News
-

 Technology1 week ago
Coinbase estimates $400M cost after data breach and crypto scam – Crypto News
-
Business1 week ago
World Liberty Financial Partners Chainlink To Enable USD1 Stablecoin Cross-Chain Transfers – Crypto News
-

 Blockchain1 week ago
Bitcoin Panic Buying? Eric Trump Says the World Is Stockpiling BTC – Crypto News
-
 Cryptocurrency1 week ago
Ripple’s XRP may enable BRICS to ditch dollar and settle trade in gold – Crypto News
-

 others1 week ago
FBI Issues New Scam Warning, Says Fraudsters Have Been Impersonating ‘Senior US Officials’ in Text and Voice Messages – Crypto News
-

 Cryptocurrency1 week ago
Galaxy Digital secures Nasdaq listing after 4 years: ‘$GLXY’ – Crypto News
-
others6 days ago
Here’s Dogecoin Price Prediction if Saudi Arabia Central Bank Drives BTC to $250,000 – Crypto News
-

 others3 days ago
Feds Charge Atlanta Man for Allegedly Applying for Over $3,390,000 in Fraudulent Small Business Loans During COVID – Crypto News
-
![Nifty 50 Index Elliott Wave technical analysis [Video]](https://dripp.zone/news/wp-content/uploads/2025/05/Nifty-50-Index-Elliott-Wave-technical-analysis-Video-Crypto-400x240.jpg)
![Nifty 50 Index Elliott Wave technical analysis [Video]](https://dripp.zone/news/wp-content/uploads/2025/05/Nifty-50-Index-Elliott-Wave-technical-analysis-Video-Crypto-80x80.jpg) others1 week ago
others1 week agoNifty 50 Index Elliott Wave technical analysis [Video] – Crypto News
-
Business1 week ago
XRP Vs Polkadot ETF: Which Crypto ETF Will Get SEC Approval First? – Crypto News
-

 Metaverse1 week ago
OpenAI expands GPT-4.1 access to ChatGPT users, replacing GPT-4o Mini for free tier – Crypto News
-

 Technology1 week ago
WWDC sneak peek: Apple Vision Pro to get smarter, could let you scroll with your eyes – Crypto News
-
others1 week ago
Crypto Prices Today: BTC, ETH, XRP & SHIB Dip Despite Soft PPI Inflation Data – Crypto News
-
others1 week ago
Crypto Prices Today: BTC, ETH, XRP & SHIB Dip Despite Soft PPI Inflation Data – Crypto News
-
others1 week ago
Crypto Prices Today: BTC, ETH, XRP & SHIB Dip Despite Soft PPI Inflation Data – Crypto News
-

 Cryptocurrency1 week ago
‘MapleStory N’ Game Launches on Avalanche With Surging NXPC Token – Crypto News
-
Technology1 week ago
Stablecoin Bill: GENIUS Act Heads For Cloture Vote on May 19 – Crypto News
-

 Cryptocurrency1 week ago
UK confirms crypto tax data rules under CARF; first deadline set for May 2027 – Crypto News
-

 Technology1 week ago
Is Apple Pay down? Users report widespread payment failures – Crypto News
-

 Metaverse4 days ago
Indian companies lag in workforce upskilling amid AI disruption, job cuts – Crypto News
-

 Technology3 days ago
Google supercharges Gemini with new AI features at I/O 2025: 13 Updates you should not miss – Crypto News
-

 Cryptocurrency3 days ago
Bitcoin’s realized cap adds $3B – Here’s why BTC’s rally isn’t over – Crypto News
-

 Blockchain1 week ago
Dogecoin Pullback May Be Short-Lived: Here’s The Next Target – Crypto News
-

 others1 week ago
NZD/USD dips as cautious Fed tone and weak NZ backdrop pressure pair – Crypto News
-
Business1 week ago
Bitcoin Price Forecast: BlackRock Leads $320M BTC Buying Spree as US ETF Flows hit $400B for 2025 – Crypto News
-

 Blockchain1 week ago
Solana Sees Renewed Demand As Capital Flows Turn Positive – Details – Crypto News
-
 Cryptocurrency1 week ago
Cardano Price Down Again On Broader Market Decline. Here’s The Way Back Up – Crypto News
-
Technology1 week ago
XRP Price Cracks 5% After Kickbacks in Ripple-SEC Lawsuit, What’s Next? – Crypto News