


others
Texas Instruments Inc (TXN) stocks Elliott Wave technical analysis [Video] – Crypto News
TXN Elliott Wave Analysis Trading Lounge Daily Chart,
Texas Instruments Inc., (TXN) Daily Chart
TXN Elliott Wave technical analysis
Function: Trend.
Mode: Impulsive.
Structure: Motive.
Position: Minor wave 3.
Direction: Upside in wave 3.
Details: We are looking at either an extension in Minor wav 3 in the making, or else we are still in wave {b} of 2. The most bearish scenario is the one where the move off the 140$ bottom is not a wave 1 and we are still in a larger degree correction.
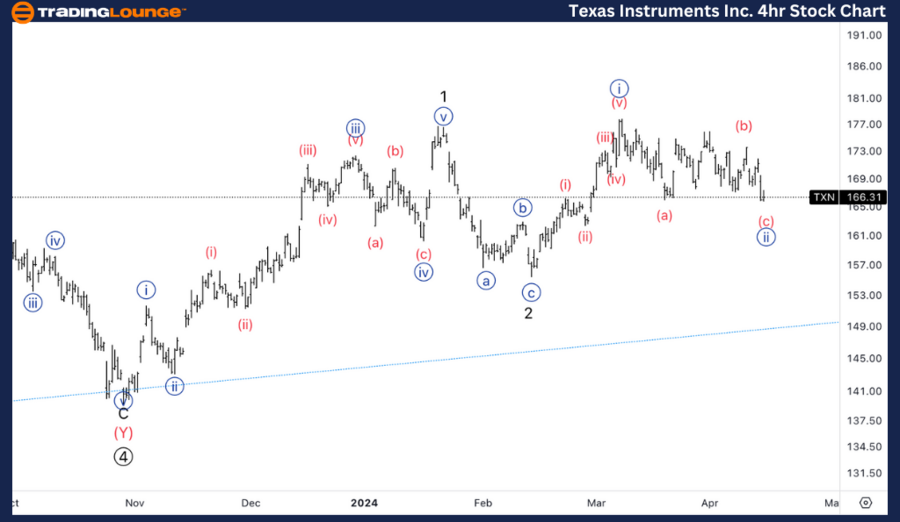
TXN Elliott Wave Analysis Trading Lounge 4Hr Chart,
Texas Instruments Inc., (TXN) 4Hr Chart.
TXN Elliott Wave technical analysis
Function: Counter Trend.
Mode: Corrective.
Structure: Flat.
Position: Wave {ii}.
Direction: Bottom in wave (c) of {ii}.
Details: We are looking at a clear three wave move in wave {ii} with a bottom soon to be in place, looking for the beginning of MGM2 at 165$ to provide support.
Welcome to our TXN Elliott Wave Analysis Trading Lounge, where we delve into Texas Instruments Inc. (TXN) using Elliott Wave Technical Analysis. Let’s dissect the market dynamics on both the Daily Chart and the 4H Chart as of April 15, 2024.
TXN Elliott Wave technical analysis – Daily chart
On the Daily Chart, our analysis reveals a trending market characterized by impulsive mode and motive structure, positioned in Minor wave 3. The direction indicates upside momentum in wave 3. However, we are considering two potential scenarios: either an extension in Minor wave 3 or still within wave {b} of 2. The most bearish scenario suggests that the move from the $140 bottom may not be a wave 1, implying a larger degree correction.
TXN Elliott Wave technical analysis – Four here chart
Here, we observe a counter trend market marked by corrective mode and flat structure, positioned in Wave {ii}. The direction hints at a bottom forming in wave (c) of {ii}. Our analysis identifies a clear three-wave move in wave {ii}, with a bottom expected soon. We anticipate support to emerge around the beginning of MGM2 at $165.
Technical analyst: Alessio Barretta.
TXN Elliott Wave technical analysis [Video]


-

 Blockchain20 hours ago
On-Chain Tokenization for Payments Professionals – Crypto News
-
Cryptocurrency6 days ago
Pi Community Highlights Pi Coin’s Slow Growth As ‘Strategic’ – Crypto News
-

 others1 week ago
There is more work to do on inflation – Crypto News
-

 Cryptocurrency1 week ago
Professor Coin: What’s Driving Cryptocurrency Adoption Around the World – Crypto News
-

 Blockchain1 week ago
CZ claps back against ‘baseless’ US plea deal allegations – Crypto News
-

 Technology1 week ago
Apple ramps up India production amid China uncertainty, assembles $22 billion worth iPhones in a year – Crypto News
-
Business5 days ago
Cardano (ADA) and Dogecoin (DOGE) Eye For Bullish Recovery – Crypto News
-

 Business5 days ago
Worldpay and FIS Deals Echo 2019’s Payments Megamergers – Crypto News
-
![Shiba Inu [SHIB] price prediction - A 70% rally next after 900%+ burn rate hike?](https://dripp.zone/news/wp-content/uploads/2025/04/Shiba-Inu-SHIB-price-prediction-A-70-rally-next-400x240.png)
![Shiba Inu [SHIB] price prediction - A 70% rally next after 900%+ burn rate hike?](https://dripp.zone/news/wp-content/uploads/2025/04/Shiba-Inu-SHIB-price-prediction-A-70-rally-next-80x80.png) Cryptocurrency1 week ago
Cryptocurrency1 week agoShiba Inu [SHIB] price prediction – A 70% rally next after 900%+ burn rate hike? – Crypto News
-

 others1 week ago
Gold consolidates near all-time peak as bulls pause for breather – Crypto News
-

 Cryptocurrency7 days ago
White House Mulls Bitcoin Reserve Backed by Gold and Tariffs – Crypto News
-

 Cryptocurrency5 days ago
OKX Returns to US Market Following $505M DOJ Deal – Crypto News
-

 Blockchain5 days ago
Solana Turns Bullish On 8H Chart – Break Above $147 Could Confirm New Trend – Crypto News
-

 Blockchain1 week ago
XRP Price To Hit $45? Here’s What Happens If It Mimics 2017 And 2021 Rallies – Crypto News
-

 others1 week ago
Ripple Community Remains Disappointed With Hinman Report, What’s Next? – Crypto News
-

 Metaverse1 week ago
Forget DeepSeek. Large language models are getting cheaper still – Crypto News
-

 others1 week ago
Crypto Strategist Sees Solana-Based Memecoin Surging Higher, Says One AI Altcoin Flashing Strong Chart – Crypto News
-

 Cryptocurrency1 week ago
Pepe is on the verge breakout to $0.0000078 as gold cross nears. – Crypto News
-

 Blockchain5 days ago
Bitcoin online chatter flips bullish as price chops at $85K: Santiment – Crypto News
-

 Cryptocurrency5 days ago
Judge Pauses 18-State Lawsuit Against SEC, Saying It Could ‘Potentially Be Resolved’ – Crypto News
-
Business5 days ago
Coinbase Reveals Efforts To Make Its Solana Infrastructure Faster, Here’s All – Crypto News
-
Technology4 days ago
Expert Predicts Pi Network Price Volatility After Shady Activity On Banxa – Crypto News
-

 Technology1 week ago
How to transcribe and translate YouTube videos for free using Gemini 2.5 Pro? Check our step-by-step guide – Crypto News
-

 Cryptocurrency1 week ago
Fusaka fork takes shape as Pectra enters final stretch – Crypto News
-

 others1 week ago
Binance Issues Important Update On 10 Crypto, Here’s All – Crypto News
-

 Cryptocurrency1 week ago
Bitcoin – Here’s what’s next after sellers near exhaustion levels – Crypto News
-

 others1 week ago
On-Chain Indicator Suggests Ethereum (ETH) Could Be Undervalued, According to Crypto Analyst – Crypto News
-

 others1 week ago
Mexican Peso ends week strong as USD plunges on China tariff retaliation – Crypto News
-

 Blockchain1 week ago
On-Chain Clues Suggest Bitcoin Bounce Might Be a False Signal—Here’s What to Know – Crypto News
-

 others1 week ago
China’s Copper imports drop – ING – Crypto News
-

 Cryptocurrency6 days ago
A decade in, Liberland needs the Bitcoin standard more than ever – Crypto News
-

 Technology5 days ago
India, Australia explore bilateral data-sharing treaty to tackle cybercrime – Crypto News
-

 Technology5 days ago
Moto Book 60 laptop, Pad 60 Pro launched in India: Price, features, battery and more – Crypto News
-
Technology5 days ago
Coinbase Reveals Efforts To Make Its Solana Infrastructure Faster, Here’s All – Crypto News
-
others5 days ago
Coinbase Reveals Efforts To Make Its Solana Infrastructure Faster, Here’s All – Crypto News
-
others4 days ago
How High Should Dogecoin Price Rise to Turn $10K to $100K? – Crypto News
-

 Technology1 week ago
Price drop on 43 inch TVs: Grab the best deals on Samsung, Sony, Xiaomi and more, up to 57% off – Crypto News
-
 Technology1 week ago
3 Altcoins to Buy as US Senate Banking Chair Gives August Deadline For Major Crypto Bills – Crypto News
-

 Blockchain1 week ago
Boosting Ethereum: Bankless Cofounder Lays Out New Vision For Price Surge – Crypto News
-
![Bearish sequence in Nifty favors downside [Video]](https://dripp.zone/news/wp-content/uploads/2025/02/Bearish-sequence-in-Nifty-favors-downside-Video-Crypto-News-400x240.png)
![Bearish sequence in Nifty favors downside [Video]](https://dripp.zone/news/wp-content/uploads/2025/02/Bearish-sequence-in-Nifty-favors-downside-Video-Crypto-News-80x80.png) others1 week ago
others1 week agoDow Jones recovers ground to post one of its best weeks in years – Crypto News
-

 Cryptocurrency1 week ago
Scottish School Will Accept Bitcoin Payments, May Launch BTC Reserve – Crypto News
-

 Blockchain1 week ago
‘Bitcoin Standard’ author to develop Austrian economics curriculum for UK school – Crypto News
-

 Business1 week ago
Michael Saylor Hints At Another MicroStrategy Bitcoin Purchase, BTC Price To Rally? – Crypto News
-
 others1 week ago
Mantra Team Responds As The OM Token Price Crashes Over 80% In 24 Hours – Crypto News
-

 others1 week ago
USD/CAD falls toward 1.3850 due to potential US recession, persistent inflation – Crypto News
-

 Blockchain1 week ago
Crypto markets ‘relatively orderly’ despite Trump tariff chaos: NYDIG – Crypto News
-

 others6 days ago
President Trump Planning Launch of New Monopoly-Inspired Crypto Game: Report – Crypto News
-

 Blockchain6 days ago
Stablecoins’ dominance due to limitations of US banking — Jerald David – Crypto News
-

 Cryptocurrency5 days ago
SOL remains bullish amid broader market stagnation – Crypto News
-

 Technology5 days ago
Spotify down: Music streaming giant leaves thousands of users affected globally – Crypto News