


others
USD/INR turns red, eyes on geopolitical turnoil, oil prices – Crypto News
- Indian Rupee gathers strength on Friday despite geopolitical tension risks, renewed USD demand.
- The fear of a wider conflict between Israel and Iran might cap the INR’s upside.
- Investors await the RBI Monetary Policy Committee (MPC) Meeting Minutes, which are due on Friday.
Indian Rupee (INR) rebounds on Friday despite geopolitical fears and foreign fund outflows. However, the escalating tension between Israel and Iran heightens concerns about a wider conflict in the Middle East, triggering the fear of an oil supply disruption. Higher oil prices hurt the INR, as India is the third-largest consumer and importer of crude oil. Furthermore, the higher demand for the US dollar (USD) on safe-haven appeal might lift the pair.
On the other hand, the USD/INR’s potential upside is limited as the Reserve Bank of India (RBI) is likely to intervene in the foreign exchange (FX) market to prevent the volatility of local currency. Investors will monitor the RBI Monetary Policy Committee (MPC) Meeting Minutes on Friday. Also, Chicago Fed Austan Goolsbee is set to speak.
Daily Digest Market Movers: The Indian Rupee remains firm amid Middle East tensions
- Trimming trade deficit, expectations of USD inflows in debt markets, and strong growth momentum have been supportive for the INR,” said Dilip Parmar, Research Analyst, HDFC Securities.
- Israeli missiles attacked a site target in Iran, ABC News said late Thursday, citing a US source, while Iranian state media claimed an explosion in the country’s center days after Iran carried out a retaliatory drone strike on Israel.
- The International Monetary Fund (IMF) raised India’s GDP growth forecast for 2024–25 to 6.8% in its update to the World Economic Outlook (WEO).
- The US Initial Jobless Claims for the week ending April 13 increased below market consensus, rising by 212,000 from the previous weekly gain of 212K (revised from 211K).
- The Philadelphia Fed Manufacturing Index jumped to 15.5 in April from 3.2 in March, beating the estimation of 1.5. The US Existing Home Sales dropped by 4.3% MoM to 4.19 million from 4.38 million, worse than the anticipated 4.2 million.
- Atlanta Fed President Raphael Bostic said US inflation is expected to return to the 2% target at a slower pace than many had anticipated, adding that he’s comfortable being patient and that rate cuts are likely by year-end.
- New York Fed President John Williams said that he doesn’t feel an urgency to cut rates and that monetary policy is in a good place.
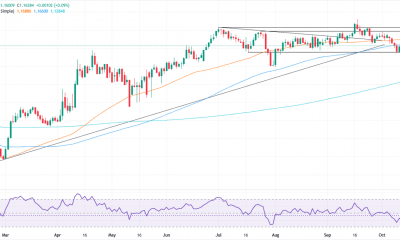
Technical analysis: USD/INR maintains a bullish outlook
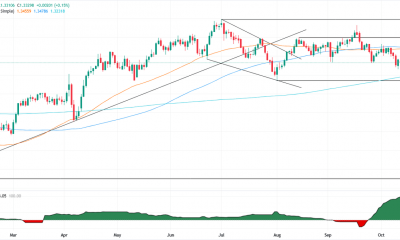
The Indian Rupee trades stronger on the day. USD/INR keeps the bullish stance unchanged as the pair is above the key 100-day Exponential Moving Average (EMA) on the daily timeframe. The upward momentum is confirmed by the 14-day Relative Strength Index (RSI), which hovers around 65.00, suggesting that support zones are more likely to hold than to break.
The first upside barrier of the pair will emerge near an all-time high of 83.72. A decisive break above this level will pave the way to the 84.00 psychological round figure. On the other hand, a low of April 18 at 83.50 acts as an initial support level, followed by a low of April 12 at 83.30. A downside break below the 100-day EMA at 83.12 might spark a sharp decline.
US Dollar price this week
The table below shows the percentage change of US Dollar (USD) against listed major currencies this week. US Dollar was the strongest against the Australian Dollar.
| USD | EUR | GBP | CAD | AUD | JPY | NZD | CHF | |
| USD | 0.11% | 0.33% | 0.12% | 1.15% | 0.64% | 1.05% | -0.64% | |
| EUR | -0.11% | 0.22% | 0.01% | 1.04% | 0.53% | 0.95% | -0.76% | |
| GBP | -0.33% | -0.22% | -0.20% | 0.84% | 0.32% | 0.73% | -0.99% | |
| CAD | -0.13% | -0.02% | 0.19% | 1.06% | 0.53% | 0.93% | -0.79% | |
| AUD | -1.18% | -1.07% | -0.86% | -1.05% | -0.53% | -0.14% | -1.83% | |
| JPY | -0.64% | -0.54% | -0.29% | -0.53% | 0.53% | 0.43% | -1.32% | |
| NZD | -1.07% | -0.95% | -0.75% | -0.94% | 0.10% | -0.42% | -1.72% | |
| CHF | 0.64% | 0.76% | 0.98% | 0.78% | 1.81% | 1.30% | 1.69% |
The heat map shows percentage changes of major currencies against each other. The base currency is picked from the left column, while the quote currency is picked from the top row. For example, if you pick the Euro from the left column and move along the horizontal line to the Japanese Yen, the percentage change displayed in the box will represent EUR (base)/JPY (quote).


-

 Blockchain1 week ago
Africa Countries Pass Crypto Laws to Attract Industry – Crypto News
-
Cryptocurrency1 week ago
XRP News: Ripple Unveils ‘Ripple Prime’ After Closing $1.25B Hidden Road Deal – Crypto News
-
others1 week ago
JPY soft and underperforming G10 in quiet trade – Scotiabank – Crypto News
-

 Blockchain1 week ago
XRP Price Gains Traction — Buyers Pile In Ahead Of Key Technical Breakout – Crypto News
-

 Blockchain1 week ago
ISM Data Hints Bitcoin Cycle Could Last Longer Than Usual – Crypto News
-
 Cryptocurrency1 week ago
What next for Avantis price after the 73% recovery? – Crypto News
-

 Technology1 week ago
Nothing OS 4.0 Beta introduces pre-installed apps to Phone (3a) series: Co-founder Akis Evangelidis explains the update – Crypto News
-

 Technology5 days ago
Sam Altman says OpenAI is developing a ‘legitimate AI researcher’ by 2028 that can discover new science on its own – Crypto News
-

 Cryptocurrency1 week ago
Trump plans to pick Michael Selig to lead CFTC: Report – Crypto News
-

 Blockchain1 week ago
Ethereum Rebounds From Bull Market Support: Can It Conquer The ‘Golden Pocket’ Next? – Crypto News
-

 De-fi1 week ago
Nearly Half of US Retail Crypto Holders Haven’t Earned Yield: MoreMarkets – Crypto News
-

 Cryptocurrency1 week ago
Bitcoin’s institutional surge widens trillion-dollar gap with altcoins – Crypto News
-

 Technology1 week ago
Uniswap Foundation (UNI) awards Brevis $9M grant to accelerate V4 adoption – Crypto News
-
 Blockchain1 week ago
Binance Stablecoin Outflow On A Steady Rise — What This Means For The Market – Crypto News
-
others1 week ago
Indian Court Declares XRP as Property in WazirX Hack Case – Crypto News
-

 Cryptocurrency1 week ago
Western Union eyes stablecoin rails in pursuit of a ‘super app’ vision – Crypto News
-

 Technology1 week ago
From Studio smoke to golden hour: How to create stunning AI portraits with Google Gemini – 16 viral prompts – Crypto News
-
Business1 week ago
PEPE Coin Price Prediction as Weekly Outflows Hit $17M – Is Rebound Ahead? – Crypto News
-

 Cryptocurrency1 week ago
HYPE Breaks Out After Robinhood Listing and S-1 Filing: What’s Next? – Crypto News
-

 De-fi1 week ago
HYPE Jumps 10% as Robinhood Announces Spot Listing – Crypto News
-
others1 week ago
Platinum price recovers from setback – Commerzbank – Crypto News
-
Business1 week ago
White House Crypto Czar Backs Michael Selig as ‘Excellent Choice’ To Lead CFTC – Crypto News
-
others1 week ago
Bitcoin Price Eyes $120K Ahead of FED’s 98.3% Likelihood to Cut Rates – Crypto News
-

 Technology1 week ago
Mint Explainer | India’s draft AI rules and how they could affect creators, social media platforms – Crypto News
-
others1 week ago
GBP/USD holds steady after UK data, US inflation fuels rate cut bets – Crypto News
-

 Blockchain1 week ago
Entire Startup Lifecycle to Move Onchain – Crypto News
-

 Blockchain1 week ago
XRP/BTC Retests 6-Year Breakout Trendline, Analyst Calls For Decoupling – Crypto News
-
 Cryptocurrency1 week ago
USDJPY Forecast: The Dollar’s Winning Streak Why New Highs Could Be At Hand – Crypto News
-
others1 week ago
Is Changpeng “CZ” Zhao Returning To Binance? Probably Not – Crypto News
-

 Cryptocurrency1 week ago
Fetch.ai and Ocean Protocol move toward resolving $120M FET dispute – Crypto News
-
Technology1 week ago
Can Hype Price Hit $50 After Robinhood Listing? – Crypto News
-

 Technology1 week ago
OpenAI announces major Sora update: Editing, trending cameos, and Android launch on the way – Crypto News
-

 Metaverse1 week ago
Gemini in Gmail automates meeting schedules effortlessly – Crypto News
-

 Cryptocurrency1 week ago
NEAR’s inflation reduction vote fails pass threshold, but it may still be implemented – Crypto News
-

 Technology1 week ago
Survival instinct? New study says some leading AI models won’t let themselves be shut down – Crypto News
-
 others7 days ago
GBP/USD floats around 1.3320 as softer US CPI reinforces Fed cut bets – Crypto News
-
 Cryptocurrency6 days ago
Citigroup and Coinbase partner to expand digital-asset payment capabilities – Crypto News
-

 Cryptocurrency5 days ago
Inside Bitwise’s milestone solana ETF launch – Crypto News
-
others1 week ago
Silver consolidates below $49 amid Fed rate-cut bets – Crypto News
-
Business1 week ago
HBAR Price Targets 50% Jump as Hedera Unleashes Massive Staking Move – Crypto News
-
 others1 week ago
EUR/USD hovers at 1.1600 as muted CPI data fails to alter Fed stance – Crypto News
-
Business1 week ago
Trump Picks SEC Crypto Counsel Michael Selig to Lead CFTC Amid Crypto Oversight Push – Crypto News
-

 Blockchain1 week ago
Pump.Fun Rallies 10% After Acquisition Of Trading Terminal Padre – Crypto News
-
Technology1 week ago
Analyst Eyes Key Support Retest Before a Rebound for Ethereum Price Amid $93M ETF Outflows and BlackRock Dump – Crypto News
-
Business1 week ago
Ripple Explores New XRP Use Cases as Brad Garlinghouse Reaffirms Token’s ‘Central’ Role – Crypto News
-
others1 week ago
Tether’s Stablecoin 1.0 Era Is Over – Now the Industry Needs 2.0 – Crypto News
-

 De-fi1 week ago
Aave Labs Acquires Stable Finance to Expand DeFi Access – Crypto News
-

 Blockchain1 week ago
Kyrgyzstan Launches Stablecoin While Confirming Future CBDC – Crypto News
-
others1 week ago
USD/JPY extends gains as strong US PMI offsets softer CPI data – Crypto News
-
Technology1 week ago
James Wynn Takes XRP Long Bet After Ripple Prime Announcement – Crypto News