


others
Wall Street trades mixed as markets assess latest US data – Crypto News
- Wall Street’s main indexes trade mixed after opening near Monday’s closing levels.
- Durable Goods Orders in the US declined sharply in January.
- Stock markets could react to US PCE inflation figures later in the week.
The Dow Jones Industrial Average (DJIA) is down 0.32% at 38,941.80, the S&P 500 (SPX) is virtually unchanged at 5,070.50 and the Nasdaq Composite (IXIC) is up 0.27% at 16,019.40 in the first half of the session on Tuesday.
Stock market news
The defensive Utilities Sector is up more nearly 1.5% as the best-performing major S&P sector in the early trade. The Energy Sector is down 0.55%.
Norwegian Cruise Line Holdings Ltd. (NCLH) and Carnival Corp. (CCL) shares are among the biggest gainers early Tuesday, rising 18% and 8%, respectively. On the other hand, SBA Communications Corp
(SBAC) is down 4.2% as the biggest decliner.
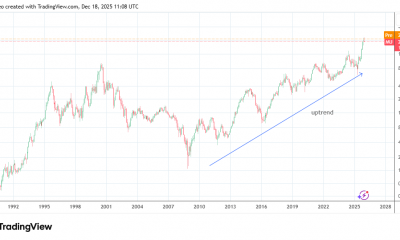
Assessing the recent action in US stock markets, “it’s an interesting week for equities as the recent run is starting to get into once in a couple of generation territory. The S&P 500 has now posted 15 weekly gains in the last 17 for the first time since 1989,” said Jim Reid, global head of economics and thematic research at Deutsche Bank, and continued:
“Moreover, if we get another positive week this week, then it would be 16 out of 18 weeks for the first time since 1971, and it would also be a joint record since the index’s formation. So even though there’s been lots of positive catalysts, from lower inflation to excitement about AI, it’s actually very unusual to see the sort of sustained rally that’s occurred over the last few months.”
Republic Services Inc. (RSG), Agilent Technologies Inc. (A), Extra Space Storage Inc. (EXR) and Coupang Inc. (CPNG) will release quarterly earnings after the closing bell on Tuesday.
Inflation FAQs
Inflation measures the rise in the price of a representative basket of goods and services. Headline inflation is usually expressed as a percentage change on a month-on-month (MoM) and year-on-year (YoY) basis. Core inflation excludes more volatile elements such as food and fuel which can fluctuate because of geopolitical and seasonal factors. Core inflation is the figure economists focus on and is the level targeted by central banks, which are mandated to keep inflation at a manageable level, usually around 2%.
The Consumer Price Index (CPI) measures the change in prices of a basket of goods and services over a period of time. It is usually expressed as a percentage change on a month-on-month (MoM) and year-on-year (YoY) basis. Core CPI is the figure targeted by central banks as it excludes volatile food and fuel inputs. When Core CPI rises above 2% it usually results in higher interest rates and vice versa when it falls below 2%. Since higher interest rates are positive for a currency, higher inflation usually results in a stronger currency. The opposite is true when inflation falls.
Although it may seem counter-intuitive, high inflation in a country pushes up the value of its currency and vice versa for lower inflation. This is because the central bank will normally raise interest rates to combat the higher inflation, which attract more global capital inflows from investors looking for a lucrative place to park their money.
Formerly, Gold was the asset investors turned to in times of high inflation because it preserved its value, and whilst investors will often still buy Gold for its safe-haven properties in times of extreme market turmoil, this is not the case most of the time. This is because when inflation is high, central banks will put up interest rates to combat it.
Higher interest rates are negative for Gold because they increase the opportunity-cost of holding Gold vis-a-vis an interest-bearing asset or placing the money in a cash deposit account. On the flipside, lower inflation tends to be positive for Gold as it brings interest rates down, making the bright metal a more viable investment alternative.
Stock markets assess US data
The US Census Bureau announced ahead of the opening bell on Tuesday that Durable Goods Orders in the United States declined by 6.1%, or $18 billion, to $276.7 billion in January. This reading followed the 0.3% decrease recorded in December and came in worse than the market expectation for a contraction of 4.5%.
Read more: US Durable Goods Orders decline 6.1% in January vs -4.5% expected.
Other US data showed that the Housing Price Index rose 0.1% in December following the 0.4% increase recorded in January. Meanwhile, Richmond Fed Manufacturing Index improved to -5 in February from -15 and Dallas Fed Manufacturing Index recovered to -11.3 from -27.4 in the same period. Finally, consumer sentiment weakened in February, with the Conference Board’s Consumer Confidence Index dropping to a three-month low at 106.7.
Read more: US CB Consumer Confidence Index missed estimates in February.
The US Bureau of Economic Analysis will announce the second estimate of the Gross Domestic Product (GDP) growth for the fourth quarter on Wednesday. Personal Consumption Expenditures (PCE) Price Index, the Federal Reserve’s (Fed) preferred gauge of inflation, figures will be scrutinized by market participants on Thursday.
New York Fed President John Williams said on Friday that he expects the US central bank to start lowering the policy rate in the second half of the year. According to the CME FedWatch Tool, markets are nearly fully pricing in a no change in the Fed policy rate in March and see an 85% probability of another pause in May.
S&P 500 FAQs
The S&P 500 is a widely followed stock price index which measures the performance of 500 publicly owned companies, and is seen as a broad measure of the US stock market. Each company’s influence on the computation of the index is weighted based on market capitalization. This is calculated by multiplying the number of publicly traded shares of the company by the share price. The S&P 500 index has achieved impressive returns – $1.00 invested in 1970 would have yielded a return of almost $192.00 in 2022. The average annual return since its inception in 1957 has been 11.9%.
Companies are selected by committee, unlike some other indexes where they are included based on set rules. Still, they must meet certain eligibility criteria, the most important of which is market capitalization, which must be greater than or equal to $12.7 billion. Other criteria include liquidity, domicile, public float, sector, financial viability, length of time publicly traded, and representation of the industries in the economy of the United States. The nine largest companies in the index account for 27.8% of the market capitalization of the index.
There are a number of ways to trade the S&P 500. Most retail brokers and spread betting platforms allow traders to use Contracts for Difference (CFD) to place bets on the direction of the price. In addition, that can buy into Index, Mutual and Exchange Traded Funds (ETF) that track the price of the S&P 500. The most liquid of the ETFs is State Street Corporation’s SPY. The Chicago Mercantile Exchange (CME) offers futures contracts in the index and the Chicago Board of Options (CMOE) offers options as well as ETFs, inverse ETFs and leveraged ETFs.
Many different factors drive the S&P 500 but mainly it is the aggregate performance of the component companies revealed in their quarterly and annual company earnings reports. US and global macroeconomic data also contributes as it impacts on investor sentiment, which if positive drives gains. The level of interest rates, set by the Federal Reserve (Fed), also influences the S&P 500 as it affects the cost of credit, on which many corporations are heavily reliant. Therefore, inflation can be a major driver as well as other metrics which impact the Fed decisions.


-
others1 week ago
Japan Foreign Investment in Japan Stocks up to ¥528.3B in December 12 from previous ¥96.8B – Crypto News
-

 Technology1 week ago
OnePlus 15R vs Pixel 9a: Which phone is the best buy under ₹50,000? Display, camera, processor and more compared – Crypto News
-

 Blockchain7 days ago
This Week in Stablecoins: Winning the Back Office – Crypto News
-

 Technology6 days ago
Apple iPhone 16 price drops to ₹40,990 in Croma’s Cromtastic December Sale: How the deal works – Crypto News
-
Technology6 days ago
Apple iPhone 16 price drops to ₹40,990 in Croma’s Cromtastic December Sale: How the deal works – Crypto News
-
Business6 days ago
XRP Holders Eye ‘Institutional Grade Yield’ as Ripple Engineer Details Upcoming XRPL Lending Protocol – Crypto News
-
Technology6 days ago
Apple iPhone 16 price drops to ₹40,990 in Croma’s Cromtastic December Sale: How the deal works – Crypto News
-

 others1 week ago
Australian Dollar loses as US Dollar advances before Michigan Sentiment Index – Crypto News
-
Business7 days ago
DOGEBALL Presale: A Boost to Bring P2E Games Back into the Spotlight – Crypto News
-
others6 days ago
XRP Holders Eye ‘Institutional Grade Yield’ as Ripple Engineer Details Upcoming XRPL Lending Protocol – Crypto News
-

 Blockchain6 days ago
Litecoin Follows Bitcoin’s Momentum, But Resistance Looms At $79.60 – Crypto News
-

 Technology6 days ago
Apple iPhone 15 price drops to ₹36,490 in Croma Cromtastic December Sale: How the deal works – Crypto News
-
Business7 days ago
125 Crypto Firms Mount Unified Defense as Banks Push to Block Stablecoin Rewards – Crypto News
-

 Technology1 week ago
US Puts Tech Deal With UK on Hold – Crypto News
-

 Blockchain1 week ago
Citi Says Identity Is the New Gatekeeper for Financial Blockchains – Crypto News
-

 Blockchain1 week ago
Blockchain’s Institutional Future Is Private and Permissioned – Crypto News
-

 Blockchain1 week ago
Bitcoin on Track For 4th Annual Decline Despite Crypto Adoption – Crypto News
-
Business6 days ago
Ethereum Faces Selling Pressure as BitMEX Co-Founder Rotates $2M Into DeFi Tokens – Crypto News
-
Technology6 days ago
Michael Saylor Sparks Debate Over Bitcoin’s Quantum Risk as Bitcoiners Dismiss It as ‘FUD’ – Crypto News
-

 Blockchain6 days ago
Crypto Market Sentiment Not Fearful Enough For Bottom: Santiment – Crypto News
-
Blockchain6 days ago
Litecoin Follows Bitcoin’s Momentum, But Resistance Looms At $79.60 – Crypto News
-

 Technology5 days ago
Samsung Galaxy S25 Ultra price drops to ₹69,999 at Croma Cromtastic December Sale? Here’s how the deal works – Crypto News
-

 others1 week ago
Japanese Yen strengthens as BoJ rate hike speculation grows – Crypto News
-
Metaverse1 week ago
How companies are using AI to squeeze more from your wallet – Crypto News
-
 Cryptocurrency1 week ago
Why quantum computing is becoming a real concern for Bitcoin – Crypto News
-
Business1 week ago
Breaking: VanEck Discloses Fees and Staking Details for its Avalanche ETF – Crypto News
-

 Blockchain7 days ago
Coinbase Launches Service to Help Businesses Create Tokens – Crypto News
-
 Cryptocurrency7 days ago
BTC at $143K, ETH above $4000: Citi issues bullish price forecasts as crypto market continues to struggle – Crypto News
-
Business7 days ago
Bitcoin Price Alarming Pattern Points to a Dip to $80k as $2.7b Options Expires Today – Crypto News
-
 Cryptocurrency6 days ago
Is ETH Ready for Sustained Recovery or Another Rejection Looms? – Crypto News
-
 Cryptocurrency6 days ago
XRP Could Add Zero If Rally Is Short-Lived – Crypto News
-
Blockchain6 days ago
Crypto Market Sentiment Not Fearful Enough For Bottom: Santiment – Crypto News
-
 Cryptocurrency5 days ago
Key Drivers & Technical Outlook – Crypto News
-
 Blockchain1 week ago
Mastercard, BlackRock Join Middle East-Focused Blockchain Effort – Crypto News
-

 Technology1 week ago
From chibi to plushie: 7 Must-try AI portraits you can create with GPT Image 1.5 – Crypto News
-
Technology1 week ago
From chibi to plushie: 7 Must-try AI portraits you can create with GPT Image 1.5 – Crypto News
-

 Metaverse7 days ago
AI Tool of the Week: Transform marketing concepts instantly. – Crypto News
-
 Blockchain6 days ago
BlackRock’s IBIT Ranks 6th in ETF Flows Despite Negative Returns – Crypto News
-

 others6 days ago
Elliott Wave, seasonality, and cycles indicate more upside – Crypto News
-
others6 days ago
Elliott Wave, seasonality, and cycles indicate more upside – Crypto News
-

 Cryptocurrency6 days ago
Crypto Industry Must Make Progress Before Trump Leaves Office: Etherealize Co-Founder – Crypto News
-
Cryptocurrency6 days ago
Crypto Industry Must Make Progress Before Trump Leaves Office: Etherealize Co-Founder – Crypto News
-

 Blockchain6 days ago
Blockchain and AI Vibe-Coding To Dethrone Amazon Web Servies: Crypto exec – Crypto News
-

 Blockchain6 days ago
Banks Need XRP To Be Pricier—Here’s Why A Finance Expert Says So – Crypto News
-

 Cryptocurrency6 days ago
Bitcoin Breaks a 10-Year Correlation With Stocks What Past Cycles Signal for 2026 – Crypto News
-

 Technology5 days ago
Sam Altman says AI’s next big breakthrough will be memory, not reasoning – Crypto News
-

 Technology5 days ago
Sam Altman teases ChatGPT Christmas Easter egg that turns your selfie into a Santa message: How it works – Crypto News
-
Technology5 days ago
Canary Capital Announces Major Changes to Its SUI ETF – Crypto News
-

 others5 days ago
Billionaire Ray Dalio Says Bitcoin Has Problems, Calls Crypto Asset Inferior to Gold – Crypto News
-

 others4 days ago
Guavy Launches Mobile App: AI-Powered Crypto Market Sentiment and Trading Signals – Crypto News