


Business
Will This Pattern Crash XRP Or Is A Bullish Revival Set For 2023? – Crypto News

Published 10 minutes ago
The XRP market has been exhibiting a head and shoulders pattern for the second half of 2022, which is often seen as a bearish signal indicating a potential decline price. This pattern occurs when buyers are unable to push the price higher after reaching a certain level of support, known as the neckline, leading to a downward trend. However, a bullish indication hints at a bounce back in 2023.
Key Points:
- A head and shoulders pattern governs the XRP price action.
- A bullish breakout from $0.4 will undermine this bearish pattern.
- The intraday trading volume in the XRP price is $372.1 million, indicating a 50% loss.
 Source- tradingview
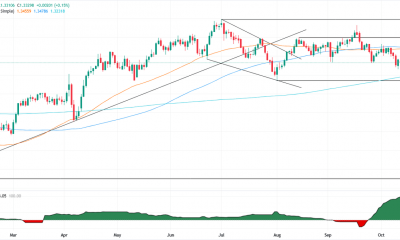
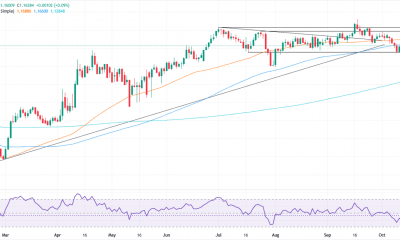
Despite the recent bullish recovery reaching the heights of the 50-day EMA, the XRP market price takes a bearish turn to create a bearish pattern coming in the long term. In the month of December, the market value of the refill token has plunged by 16.5% and trades slightly below the mark of $0.35.
Coming back to the long term pattern, the price trend shows a head and shoulders pattern forming on the daily chart with the neckline at $0.31-0.3. The neckline gains credibility by acting as a strong support level during the consolidation phase between June and October.
Also read – XRP Lawsuit: Are XRP Holders Biggest Loser In Ripple Case? Attorney Suggests This
Continuing the falling trend under the bearish aligned EMAs, the market value may soon succumb below the neckline highlighting a bearish entry point.
In such a case, XRP investors can witness further decline in market price, potentially a drop of 37% to the next support level at $0.18.
On a contrary note, if the new year brings new investors for ripple, a reversal above the neckline crossing the $0.40 mark will break the bearish hypothesis.
Additionally, to support the bullish reversal a double bottom pattern is evident within the right shoulder of the bearish pattern.
Considering, the bulls gain momentum in 2023, a double bottom breakout could revive the XRP buying spree.
technical indicators
EMA: undermining the recovery in November and December, the crucial daily EMAs- 20, 50, 100, 200 maintain a negative trend displaying a long term bearish phase in action.
Relative strength indicator: the rsi The slope shows a short-term decline from the midline but the bullish divergence in the double bottom pattern keeps the hope burning for XRP buyers.
XRP intraday price levels
- Spot price: $0.344
- Trend: Bearish
- Volatility: High
- Resistance level- $0.373 and $0.41
- Support levels- $0.31 and $0.26
The content presented may include the personal opinion of the author and is subject to market conditions. Do your market research before investing in cryptocurrencies. The author or the publication does not hold any responsibility for your personal financial loss.
-

 Blockchain1 week ago
Africa Countries Pass Crypto Laws to Attract Industry – Crypto News
-
Cryptocurrency1 week ago
XRP News: Ripple Unveils ‘Ripple Prime’ After Closing $1.25B Hidden Road Deal – Crypto News
-
others1 week ago
JPY soft and underperforming G10 in quiet trade – Scotiabank – Crypto News
-
 Blockchain1 week ago
XRP Price Gains Traction — Buyers Pile In Ahead Of Key Technical Breakout – Crypto News
-

 Blockchain1 week ago
ISM Data Hints Bitcoin Cycle Could Last Longer Than Usual – Crypto News
-
 Cryptocurrency1 week ago
What next for Avantis price after the 73% recovery? – Crypto News
-

 Technology1 week ago
Nothing OS 4.0 Beta introduces pre-installed apps to Phone (3a) series: Co-founder Akis Evangelidis explains the update – Crypto News
-

 Technology5 days ago
Sam Altman says OpenAI is developing a ‘legitimate AI researcher’ by 2028 that can discover new science on its own – Crypto News
-

 Cryptocurrency1 week ago
Trump plans to pick Michael Selig to lead CFTC: Report – Crypto News
-

 Blockchain1 week ago
Ethereum Rebounds From Bull Market Support: Can It Conquer The ‘Golden Pocket’ Next? – Crypto News
-

 De-fi1 week ago
Nearly Half of US Retail Crypto Holders Haven’t Earned Yield: MoreMarkets – Crypto News
-
 Cryptocurrency1 week ago
Bitcoin’s institutional surge widens trillion-dollar gap with altcoins – Crypto News
-
 Technology1 week ago
Uniswap Foundation (UNI) awards Brevis $9M grant to accelerate V4 adoption – Crypto News
-
 Blockchain1 week ago
Binance Stablecoin Outflow On A Steady Rise — What This Means For The Market – Crypto News
-
others1 week ago
Indian Court Declares XRP as Property in WazirX Hack Case – Crypto News
-

 Cryptocurrency1 week ago
Western Union eyes stablecoin rails in pursuit of a ‘super app’ vision – Crypto News
-

 Technology1 week ago
From Studio smoke to golden hour: How to create stunning AI portraits with Google Gemini – 16 viral prompts – Crypto News
-
Business1 week ago
PEPE Coin Price Prediction as Weekly Outflows Hit $17M – Is Rebound Ahead? – Crypto News
-

 Cryptocurrency1 week ago
HYPE Breaks Out After Robinhood Listing and S-1 Filing: What’s Next? – Crypto News
-

 De-fi1 week ago
HYPE Jumps 10% as Robinhood Announces Spot Listing – Crypto News
-
others1 week ago
Platinum price recovers from setback – Commerzbank – Crypto News
-
Business1 week ago
White House Crypto Czar Backs Michael Selig as ‘Excellent Choice’ To Lead CFTC – Crypto News
-
others1 week ago
Bitcoin Price Eyes $120K Ahead of FED’s 98.3% Likelihood to Cut Rates – Crypto News
-

 Technology1 week ago
Mint Explainer | India’s draft AI rules and how they could affect creators, social media platforms – Crypto News
-
others1 week ago
GBP/USD holds steady after UK data, US inflation fuels rate cut bets – Crypto News
-

 Blockchain1 week ago
Entire Startup Lifecycle to Move Onchain – Crypto News
-

 Blockchain1 week ago
XRP/BTC Retests 6-Year Breakout Trendline, Analyst Calls For Decoupling – Crypto News
-
 Cryptocurrency1 week ago
USDJPY Forecast: The Dollar’s Winning Streak Why New Highs Could Be At Hand – Crypto News
-
others1 week ago
Is Changpeng “CZ” Zhao Returning To Binance? Probably Not – Crypto News
-
Technology1 week ago
Can Hype Price Hit $50 After Robinhood Listing? – Crypto News
-

 Technology1 week ago
OpenAI announces major Sora update: Editing, trending cameos, and Android launch on the way – Crypto News
-

 Metaverse1 week ago
Gemini in Gmail automates meeting schedules effortlessly – Crypto News
-

 Cryptocurrency1 week ago
NEAR’s inflation reduction vote fails pass threshold, but it may still be implemented – Crypto News
-

 Technology1 week ago
Survival instinct? New study says some leading AI models won’t let themselves be shut down – Crypto News
-
 others7 days ago
GBP/USD floats around 1.3320 as softer US CPI reinforces Fed cut bets – Crypto News
-
 Cryptocurrency6 days ago
Citigroup and Coinbase partner to expand digital-asset payment capabilities – Crypto News
-

 Cryptocurrency5 days ago
Inside Bitwise’s milestone solana ETF launch – Crypto News
-
others1 week ago
Silver consolidates below $49 amid Fed rate-cut bets – Crypto News
-
Business1 week ago
HBAR Price Targets 50% Jump as Hedera Unleashes Massive Staking Move – Crypto News
-
 others1 week ago
EUR/USD hovers at 1.1600 as muted CPI data fails to alter Fed stance – Crypto News
-
Business1 week ago
Trump Picks SEC Crypto Counsel Michael Selig to Lead CFTC Amid Crypto Oversight Push – Crypto News
-

 Blockchain1 week ago
Pump.Fun Rallies 10% After Acquisition Of Trading Terminal Padre – Crypto News
-
Technology1 week ago
Analyst Eyes Key Support Retest Before a Rebound for Ethereum Price Amid $93M ETF Outflows and BlackRock Dump – Crypto News
-
Business1 week ago
Ripple Explores New XRP Use Cases as Brad Garlinghouse Reaffirms Token’s ‘Central’ Role – Crypto News
-
others1 week ago
Tether’s Stablecoin 1.0 Era Is Over – Now the Industry Needs 2.0 – Crypto News
-

 De-fi1 week ago
Aave Labs Acquires Stable Finance to Expand DeFi Access – Crypto News
-

 Blockchain1 week ago
Kyrgyzstan Launches Stablecoin While Confirming Future CBDC – Crypto News
-
others1 week ago
USD/JPY extends gains as strong US PMI offsets softer CPI data – Crypto News
-
Technology1 week ago
James Wynn Takes XRP Long Bet After Ripple Prime Announcement – Crypto News
-
 Cryptocurrency1 week ago
Crypto wrap: Bitcoin, Ethereum, BNB, Solana, and XRP muted after CPI report – Crypto News