others
Apple Inc. (AAPL) stocks Elliott Wave technical analysis [Video] – Crypto News

AAPL Elliott Wave Analysis Trading Lounge Daily Chart,
Apple Inc., (AAPL) Daily Chart.
AAPL Elliott Wave technical analysis
Function: Trend.
Mode: Impulsive.
Structure: Motive.
Position: Wave 3.
Direction: Upside in wave 3.
Details: Looking for wave 3 to unfold as we seem to be in a third of a third. Equality of 3 vs. 1 stand at 254$ while 1.618 3 vs. 1 stands at 350$.
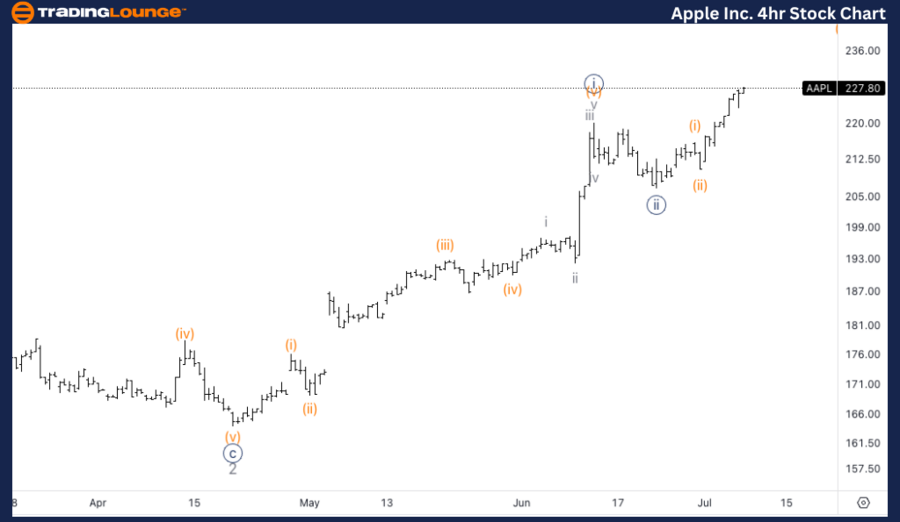
AAPL Elliott Wave Analysis Trading Lounge 4Hr Chart,
Apple Inc., (AAPL) 4Hr Chart.
AAPL Elliott Wave technical analysis
Function: Trend.
Mode: Impulsive.
Structure: Motive.
Position: Wave {iii}.
Direction: Upside in (iii) of {iii}.
Details: Looking for upside into wave (iii). We could expect some “turbulence” around 230$ at the end of MG1, to then move towards Medium Level at 250.
Welcome to our latest Elliott Wave analysis for Apple Inc. (AAPL). This analysis provides an in-depth look at AAPL’s price movements using the Elliott Wave Theory, helping traders identify potential opportunities based on current trends and market structure. We will cover insights from both the daily and 4-hour charts to offer a comprehensive perspective on AAPL’s market behavior.
AAPL Elliott Wave technical analysis – Daily chart
The daily chart indicates that AAPL is in the midst of wave 3, specifically in the third of a third wave, which is often the most powerful phase in the Elliott Wave sequence. The equality of wave 3 vs. wave 1 stands at $254, while the 1.618 extension of wave 3 vs. wave 1 targets $350. This suggests substantial upside potential if the wave structure unfolds as expected. Traders should monitor for strong upward movements and prepare for potential resistance at these key levels.
AAPL Elliott Wave technical analysis – Four-hour chart
The 4-hour chart shows that AAPL is advancing into wave (iii) of {iii}. As wave (iii) progresses, we can expect some “turbulence” around the $230 level, which corresponds to the end of MinorGroup1 (MG1). After overcoming this level, the next target is the Medium Level at $250. This aligns with the daily chart’s projection and reinforces the bullish scenario.
Technical analyst: Alessio Barretta.