


others
S&P/TSX 60 Index Elliott Wave technical analysis [Video] – Crypto News
S&P/TSX 60 Elliott Wave technical analysis – Day chart
Function: Bullish Trend.
Mode: Impulsive.
Structure: Orange wave 1.
Position: Navy blue wave 3.
Direction next lower degrees: Orange wave 2.
Details: Navy blue wave 2 appears complete; orange wave 1 of wave 3 is developing.
Invalidation level: 1339.
The daily Elliott Wave analysis for the S&P/TSX 60 indicates a bullish trend supported by impulsive price action. The current structure shows orange wave 1 forming within navy blue wave 3, signaling the onset of a broader upward trend. The next lower-degree movement expected is orange wave 2, a corrective pullback likely to follow wave 1’s completion.
Analysis shows navy blue wave 2 has concluded, and orange wave 1 is now advancing. This development supports growing bullish momentum and the potential for further upward movement. If the price drops below 1339, the wave count becomes invalid, requiring a re-evaluation of the trend.
The impulsive wave structure reflects increased buying strength, with the invalidation level of 1339 serving as a vital support level. As long as the price remains above this mark, the bullish setup remains intact. Traders are advised to monitor for the end of orange wave 1 and prepare for orange wave 2’s retracement before a potential rise in wave 3 resumes.
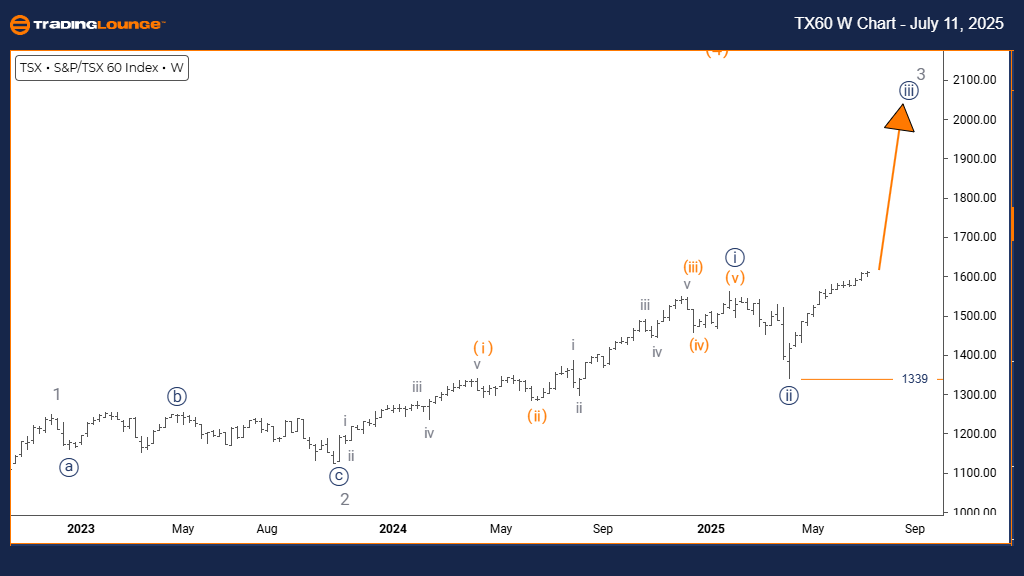
S&P/TSX 60 Elliott Wave technical analysis – Weekly chart
Function: Bullish Trend.
Mode: Impulsive.
Structure: Navy blue wave 3.
Position: Gray wave 3.
Direction next lower degrees: Navy blue wave 4.
DETAILS: Navy blue wave 2 appears complete; navy blue wave 3 of gray wave 3 is active.
Invalidation Level: 1339.
The weekly chart of the S&P/TSX 60 index reveals a strong bullish trend using Elliott Wave analysis. The chart identifies navy blue wave 3 within a larger gray wave 3, highlighting an impulsive upward movement. The next anticipated structure is navy blue wave 4, which typically represents a brief corrective phase before the continuation of the trend.
Based on the analysis, navy blue wave 2 has likely finished, and wave 3 is in progress, indicating rising bullish momentum. A drop below the 1339 level would invalidate the current wave count and prompt a reassessment of the market’s direction.
The impulsive price action signals sustained buying strength, reinforcing the bullish narrative. Traders should track the evolution of navy blue wave 3, watching for signs of its completion and the beginning of wave 4. The invalidation point at 1339 remains a critical marker to uphold this trend view.
This framework aids traders in forecasting potential price moves and making strategy adjustments. As long as prices stay above the invalidation level, the outlook remains positive for further gains in the S&P/TSX 60 index.
S&P/TSX 60 Index Elliott Wave technical analysis [Video]


-

 Metaverse1 week ago
What Satya Nadella’s latest shakeup says about Microsoft’s evolving AI strategy – Crypto News
-
Metaverse1 week ago
What Satya Nadella’s latest shakeup says about Microsoft’s evolving AI strategy – Crypto News
-
Technology1 week ago
Breaking: China Renaissance Bank Eyes $600M Raise for BNB-Focused Fund with YZI Labs – Crypto News
-

 Cryptocurrency6 days ago
Stripe’s stablecoin biz seeks national bank trust charter – Crypto News
-

 Technology1 week ago
AI isn’t the dot-com bubble, but that won’t stop it from ending badly – Crypto News
-

 Technology1 week ago
Best phones under ₹15,000: Oppo K13 5G, Infinix Note 50s, iQOO Z10x and more – Crypto News
-

 others1 week ago
EUR/JPY retreats as Euro slides on French political uncertainty – Crypto News
-

 Metaverse1 week ago
human intelligence for artificial minds – Crypto News
-

 others1 week ago
China’s Commerce Ministry urges US to correct its wrong practices as soon as possible – Crypto News
-

 Technology1 week ago
ChatGPT will soon pay for you! India’s AI payment pilot set to go live: What it means for users – Crypto News
-

 Blockchain1 week ago
Crypto Traders Show ‘Rationalization’ Behavior’ After Market Plunge – Crypto News
-

 Cryptocurrency1 week ago
Why Bitcoin could rebound up to 21% this week: experts explain – Crypto News
-

 Cryptocurrency1 week ago
Shiba Inu Burn Rate Crashes 99% as Crypto Sees Largest Liquidation Event Ever – Crypto News
-

 others1 week ago
Trump’s tariff threat pushes US Dollar below 99 amid trade tensions – Crypto News
-

 others1 week ago
Which way out of the range – Crypto News
-

 Cryptocurrency1 week ago
How Solana Overtook Ethereum’s Early Growth Curve – Crypto News
-

 Cryptocurrency1 week ago
Crypto liquidations drive historic market turbulence – Crypto News
-
others1 week ago
Peter Brandt Flips Bullish on Bitcoin, Ethereum, XRP, and XLM – Crypto News
-

 others1 week ago
A balanced approach to monetary policy only works if inflation expectations are anchored – Crypto News
-
others1 week ago
Binance Founder CZ Addresses BNB’s Recent Strong Price Performance, Says It Has No Market Makers – Crypto News
-

 Metaverse7 days ago
Walmart teams with OpenAI for ChatGPT purchases. The retailer is ‘ahead of the curve’. – Crypto News
-

 Cryptocurrency1 week ago
The Latest Nobel Peace Prize Winner Is a Bitcoin Supporter – Crypto News
-

 De-fi1 week ago
DeFi Withstands Stress Test as Market Mayhem Wipes Out Nearly $20B – Crypto News
-
Technology1 week ago
Fed’s Anna Paulson Backs Rate Cuts, Downplays Trump Tariff Impact – Crypto News
-

 Technology6 days ago
Apple launches MacBook Pro 14-inch with M5 chip in India, price starts at ₹1,69,900 – Crypto News
-

 Blockchain1 week ago
How to Use ChatGPT to Discover Hidden Crypto Gems – Crypto News
-

 Cryptocurrency1 week ago
Polymarket bets trigger Nobel leak probe in Norway – Crypto News
-
 Cryptocurrency1 week ago
How Crypto Traders Are Positioning Following ‘Black-Friday’s’ Crash – Crypto News
-
others1 week ago
Crypto Market Braces for Volatility Ahead of Key U.S. Economic Events This Week – Crypto News
-
Technology1 week ago
XRP Price Crashes as Whales Dump 2.23B Tokens — Is $2 the Next Stop? – Crypto News
-

 Cryptocurrency1 week ago
$23 Billion XRP Milestone Spotlighted by CME Group: Details – Crypto News
-

 Cryptocurrency1 week ago
Powell speech steadies crypto market: Fed hints at slower balance-sheet runoff – Crypto News
-
Business7 days ago
Pro Says Ethereum Price is a Buy Despite Rising Liquidations and BlackRock Selling – Crypto News
-
Business7 days ago
Pro Says Ethereum Price is a Buy Despite Rising Liquidations and BlackRock Selling – Crypto News
-

 Cryptocurrency1 week ago
Decoding WLFI’s meltdown – Can a $7mln buyback undo a $190mln dump? – Crypto News
-

 Technology1 week ago
How to create 90’s retro-style Diwali AI portraits with Google Gemini Nano: 50 Viral prompts to try – Crypto News
-
Business1 week ago
Crypto Market Recovery: BTC, ETH, XRP, DOGE Surge 4-12% As Expert Sees V-Shape Upside – Crypto News
-

 Cryptocurrency1 week ago
Is It Good to Invest in Ripple Now? – Crypto News
-

 Technology1 week ago
AMD strengthens AI push: Oracle to deploy 50,000 MI450 AI chips in data centers starting 2026 – Crypto News
-

 others7 days ago
Seems ‘prudent’ to cut rates further given lower inflation risks – Crypto News
-

 Cryptocurrency7 days ago
Beyond Bitcoin: How Asia’s new crypto playbook is breaking from the west – Crypto News
-

 Cryptocurrency7 days ago
Celestia price reclaims $1 after crash to $0.27: TIA forecast – Crypto News
-

 Metaverse6 days ago
ChatGPT ‘adult model’ plan: OpenAI’s Sam Altman reacts to criticism, says ‘not elected moral police’ – Crypto News
-

 others1 week ago
GBP/USD hits a two-month low as UK fiscal concerns weigh – Crypto News
-

 Technology1 week ago
Gemini Nano Banana model now generates and edits images inside Google apps: How it works – Crypto News
-
![Car Group Limited – CAR Elliott Wave technical analysis [Video]](https://dripp.zone/news/wp-content/uploads/2025/05/Car-Group-Limited-–-CAR-Elliott-Wave-technical-analysis-Video-400x240.jpg)
![Car Group Limited – CAR Elliott Wave technical analysis [Video]](https://dripp.zone/news/wp-content/uploads/2025/05/Car-Group-Limited-–-CAR-Elliott-Wave-technical-analysis-Video-80x80.jpg) others1 week ago
others1 week agoSamsara Inc. (IOT) laps the stock market: Here’s why – Crypto News
-
others1 week ago
Four Meme and BNB Partner on $45M ‘Rebirth Support’ Airdrop, First Batch Set to Begin – Crypto News
-

 Metaverse7 days ago
‘Erotica for verified adults’: OpenAI to allow mature content on ChatGPT; Sam Altman vows to treat adults like adults – Crypto News
-

 Cryptocurrency7 days ago
Bitcoin, Ethereum rebound following ‘largest single-day wipeout in crypto history’ – Crypto News
-
Business6 days ago
Nasdaq-Listed Webus Adopts XRP in New Tokenized Reward Platform, Eyes $20B Loyalty Market – Crypto News